For my network analysis, I explored character interactions in Shakespeare’s Hamlet. I chose this text because I just finished reading it again for my textual analysis class for a project. Since I was refamiliarized with its layout, I figured I would be able to easily spot discrepancies in the output from Gephi, the software that I used. However, everything looks like it came out as best I could have hoped. I also knew there are many characters in Hamlet, so it would make for entertaining social network analysis.
Since I don’t know of any databases with Shakesperian play edge lists, I had to make my data by hand. This was the most time-consuming part. I went through the play and created a pair of edges in Excel for each time a character interacted with another, once per scene. In other words, it was a personal choice to only mark each interaction only one time a scene, as I felt like it would have been too tedious to do so every time character’s spoke to one another, as there are many long interactions. It seemed as though there was much more room for error with this route too. However, I did wonder how different my network analysis would have looked if I did do it this way. Perhaps in the future if I have more time, I’d go back and do it this way, or perhaps there is something built in the software where I could count the number of interactions and plug it in that way as opposed to having a binary pair in Excel in two columns for each interaction.
One of the issues I had that could be seen as a weakness on behalf of the data was deciding who was exactly interacting with who. There are scenes where, say, King Claudius is speaking, so do I mark an edge with everyone who is present in the scene? It was a judgement call, but I didn’t do it that way. I came to my own conclusion who is likely being addressed (there were multiple people in some instances) and I never made an edge out of an entire cast of characters in a scene. But it is possible that I did miss some interactions, due to skipping over characters being addressed that I didn’t realize as I was going through the text. This is where better/stronger textual analysis skills would have come in handy, so I wouldn’t have had to do this manually, but I am a way’s off from writing programs that would be able to pull out this kind of data.
There are five acts of Hamlet, so I had six Excel worksheets. One for each act of five or so scenes, and the final one is a composite of all the scenes to show the relations throughout the duration of the entire play. To be clear, I only made an edge pair per one interaction per scene, which are all on one Excel worksheet per each act, and the final compounded list. That list had 77 edges and 33 nodes. However it did work out that you can see some thicker edges and that signifies that the edge pair interacted more than once per act, so that is a cool thing to have illustrated.
Once my data was imported into Gephi, I spent a good deal of time choosing how I wanted to layout my output. I couldn’t leave the nodes in place as they were because they were too close to one another to be visible or useful, so I had to drag nodes around to different areas of the Gephi workspace. I also had to play around with Gephi a bit before collecting my data to figure out how I wanted to layout my worksheets in Excel. I realized there would be a learning curve to account for how Gephi would read sheets and spreadsheets. As I found out, or at least was able to come up with, one workspace in Gephi = one worksheet in Excel. So, I would be happy to know how to combine workspaces in order to not have to do that manually in my final worksheet like I ended up doing.
I wouldn’t say my analysis really reveals anything to provocative that you wouldn’t have understood just by reading Hamlet. It is pretty apparent who speaks the most and to whom. But it was fun and meaningful taking a literary text and mining it for data and then playing around with that data in Gephi. It has been a while since I’ve used this software last, so it was good to reacquaint myself with it. One thing I never really mastered in Gephi is how to find different types of visualizations such as the work of Micki Kaufman, who mad many. Mine is pretty bare bones, but it goes to show what social network analysis looks like and does in case anyone in our class had questions about it in terms of practicality. And I felt like a real digital humanist!
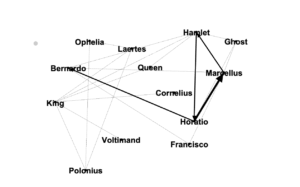
Act 1
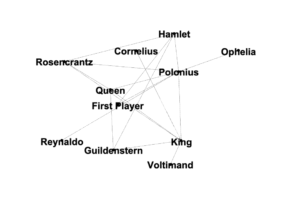
Act 2
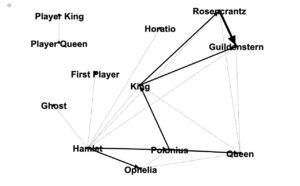
Act 3

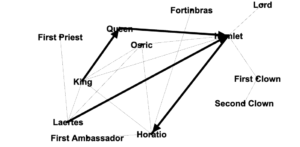
Act 4
Act 5
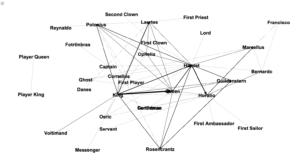
All Acts