For the network analysis praxis assignment, I looked at what hashtags appear in tweets that contain “Ted Cruz” or “#tedcruz” during an 18-minute time frame. I used the Twitter Streaming Importer plugin in Gephi (video tutorial), which collects tweets according to set criteria and presents a network visualization of the results. Seeing as the Texas Senate race is one of the most visible in the midterm elections – and because the senator draws polarizing opinions – I was curious to see whether there would be a disparity in the kind of hashtags associated with Cruz tweets. I went with the short period of time so that the visualization would not get too crowded, and because the incoming data was becoming a bit much for my computer.
A few questions going into the assignment:
- Easiest one: Which hashtags appear the most?
- Will one side of the political spectrum tend to use certain hashtags (that don’t clearly indicate preference) over the other side?
- Will there be more hashtags from presumed Democrats or Republicans? That is, based on hashtags that clearly show political preference.
- Are any [hashtagged] figures frequently mentioned in “Ted Cruz tweets,” such as Trump or opponent Beto O’Rourke?

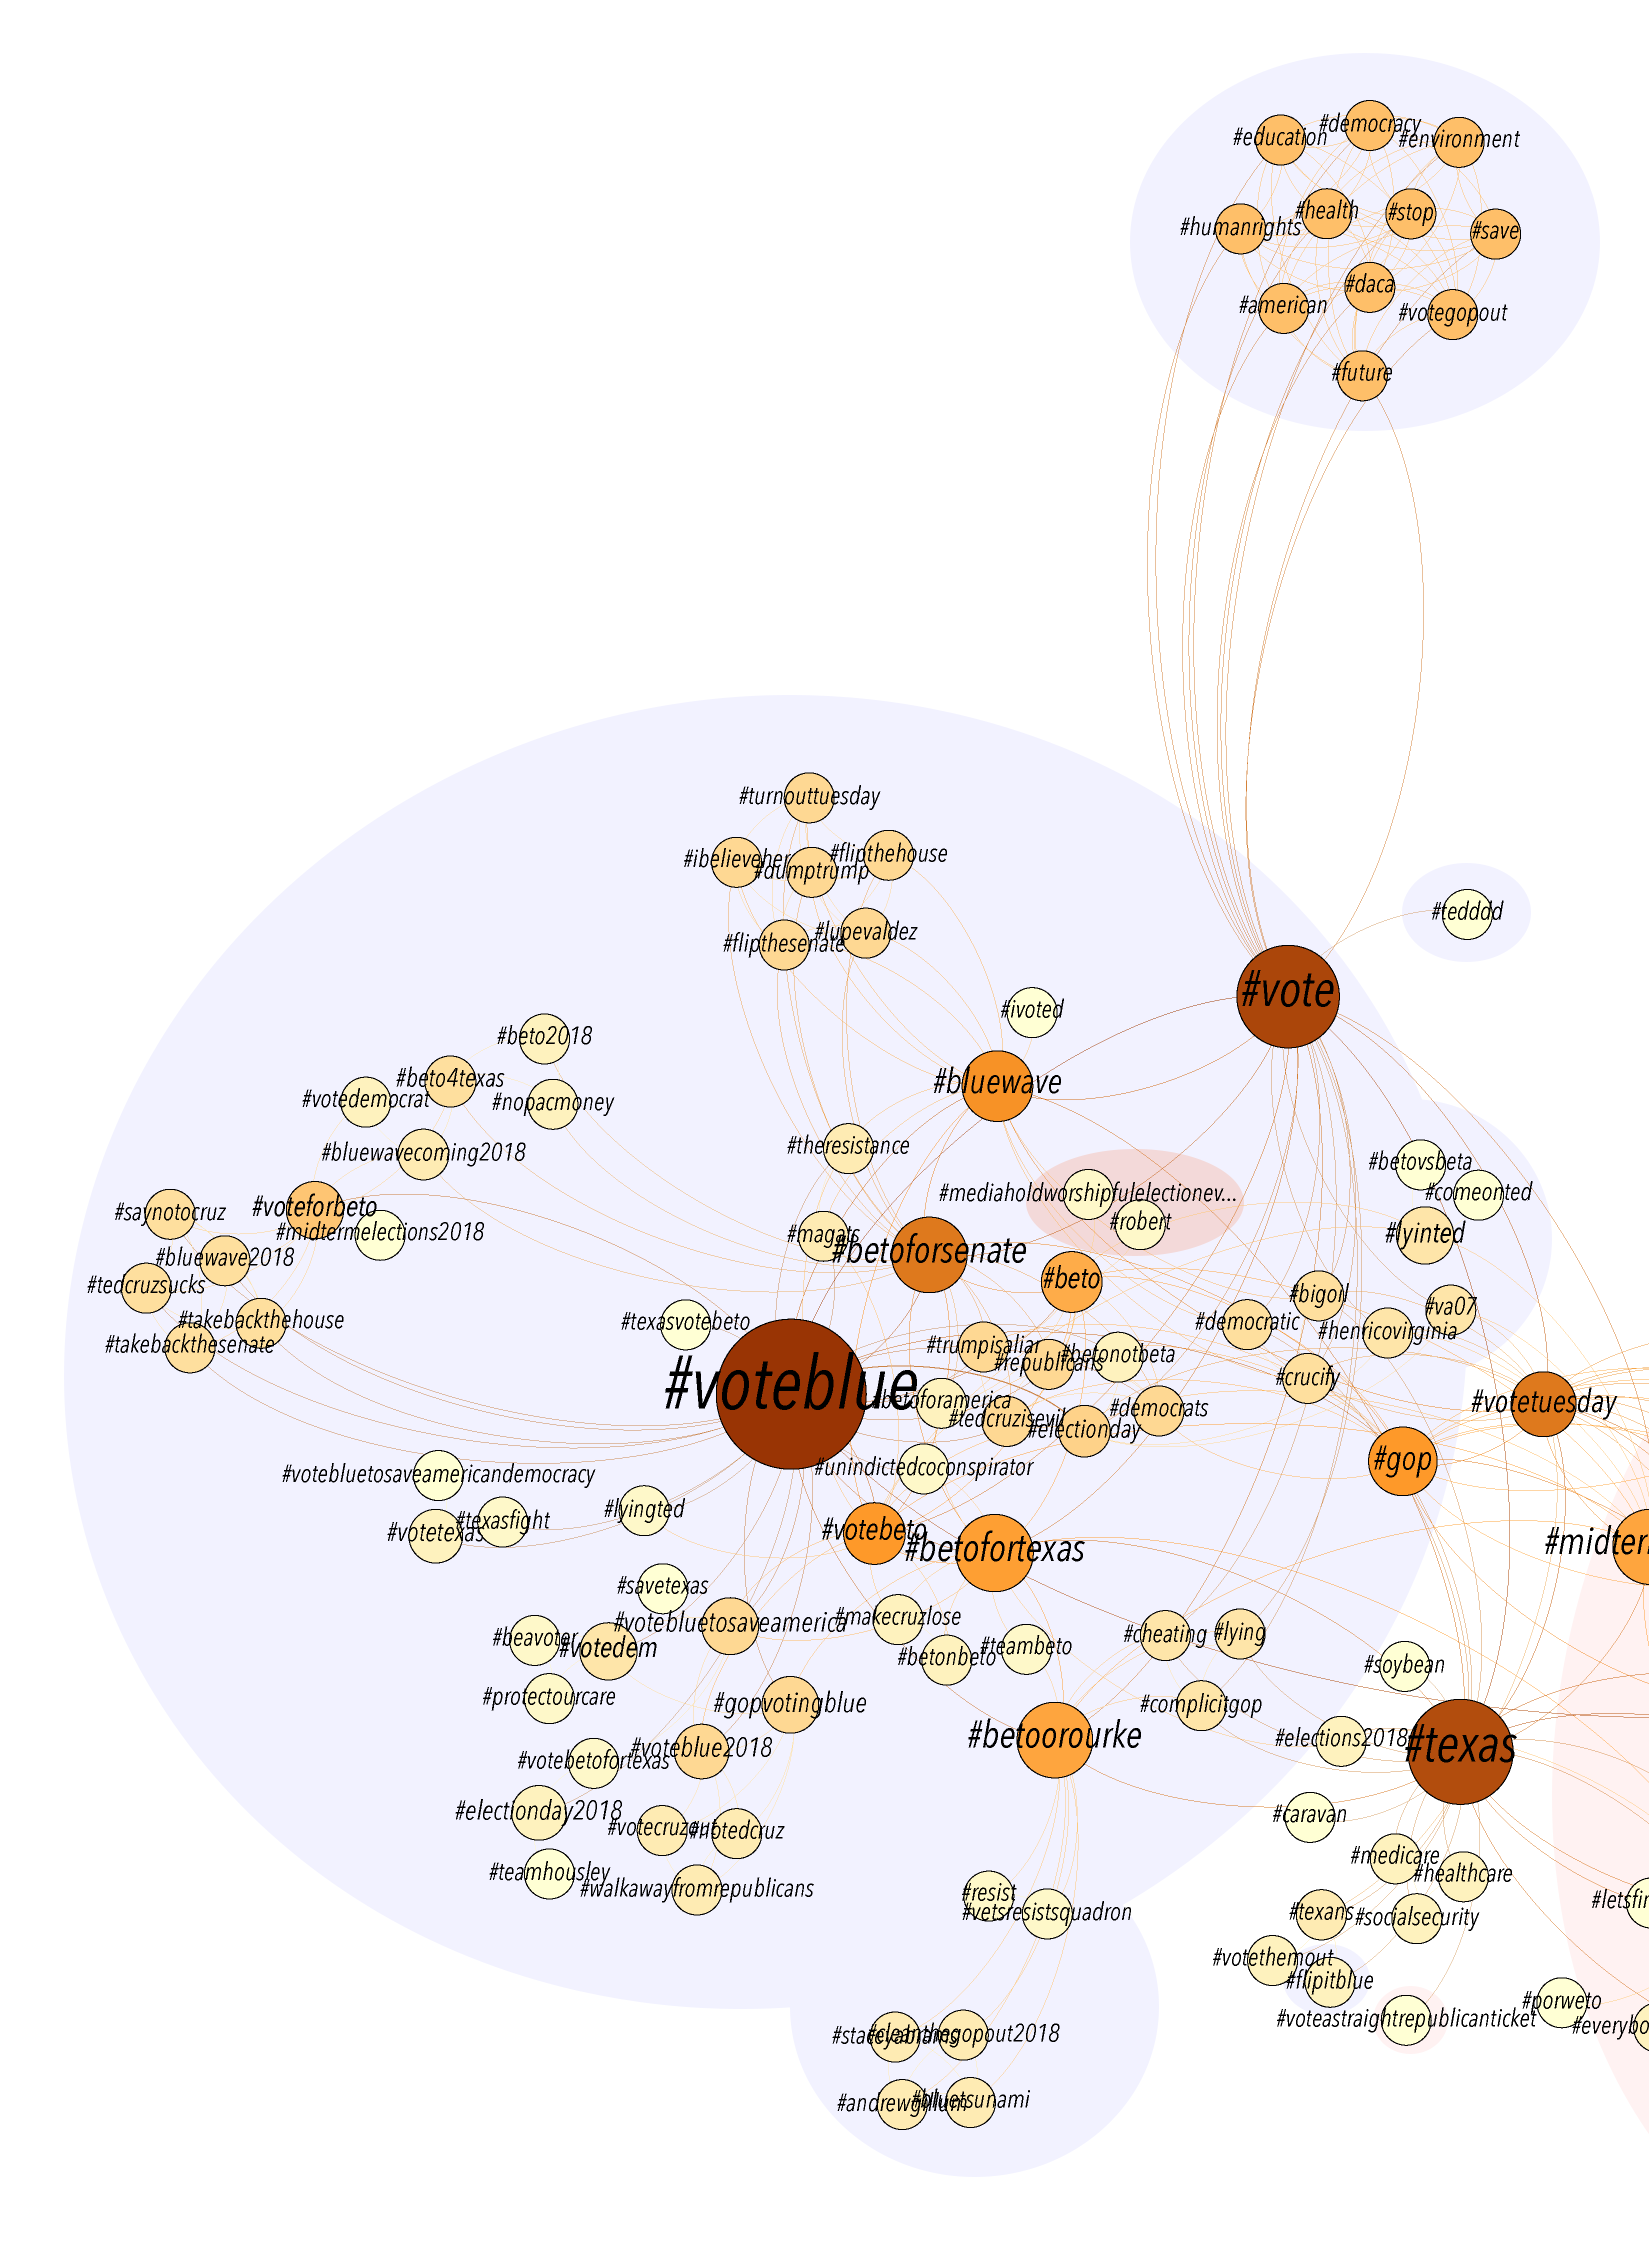
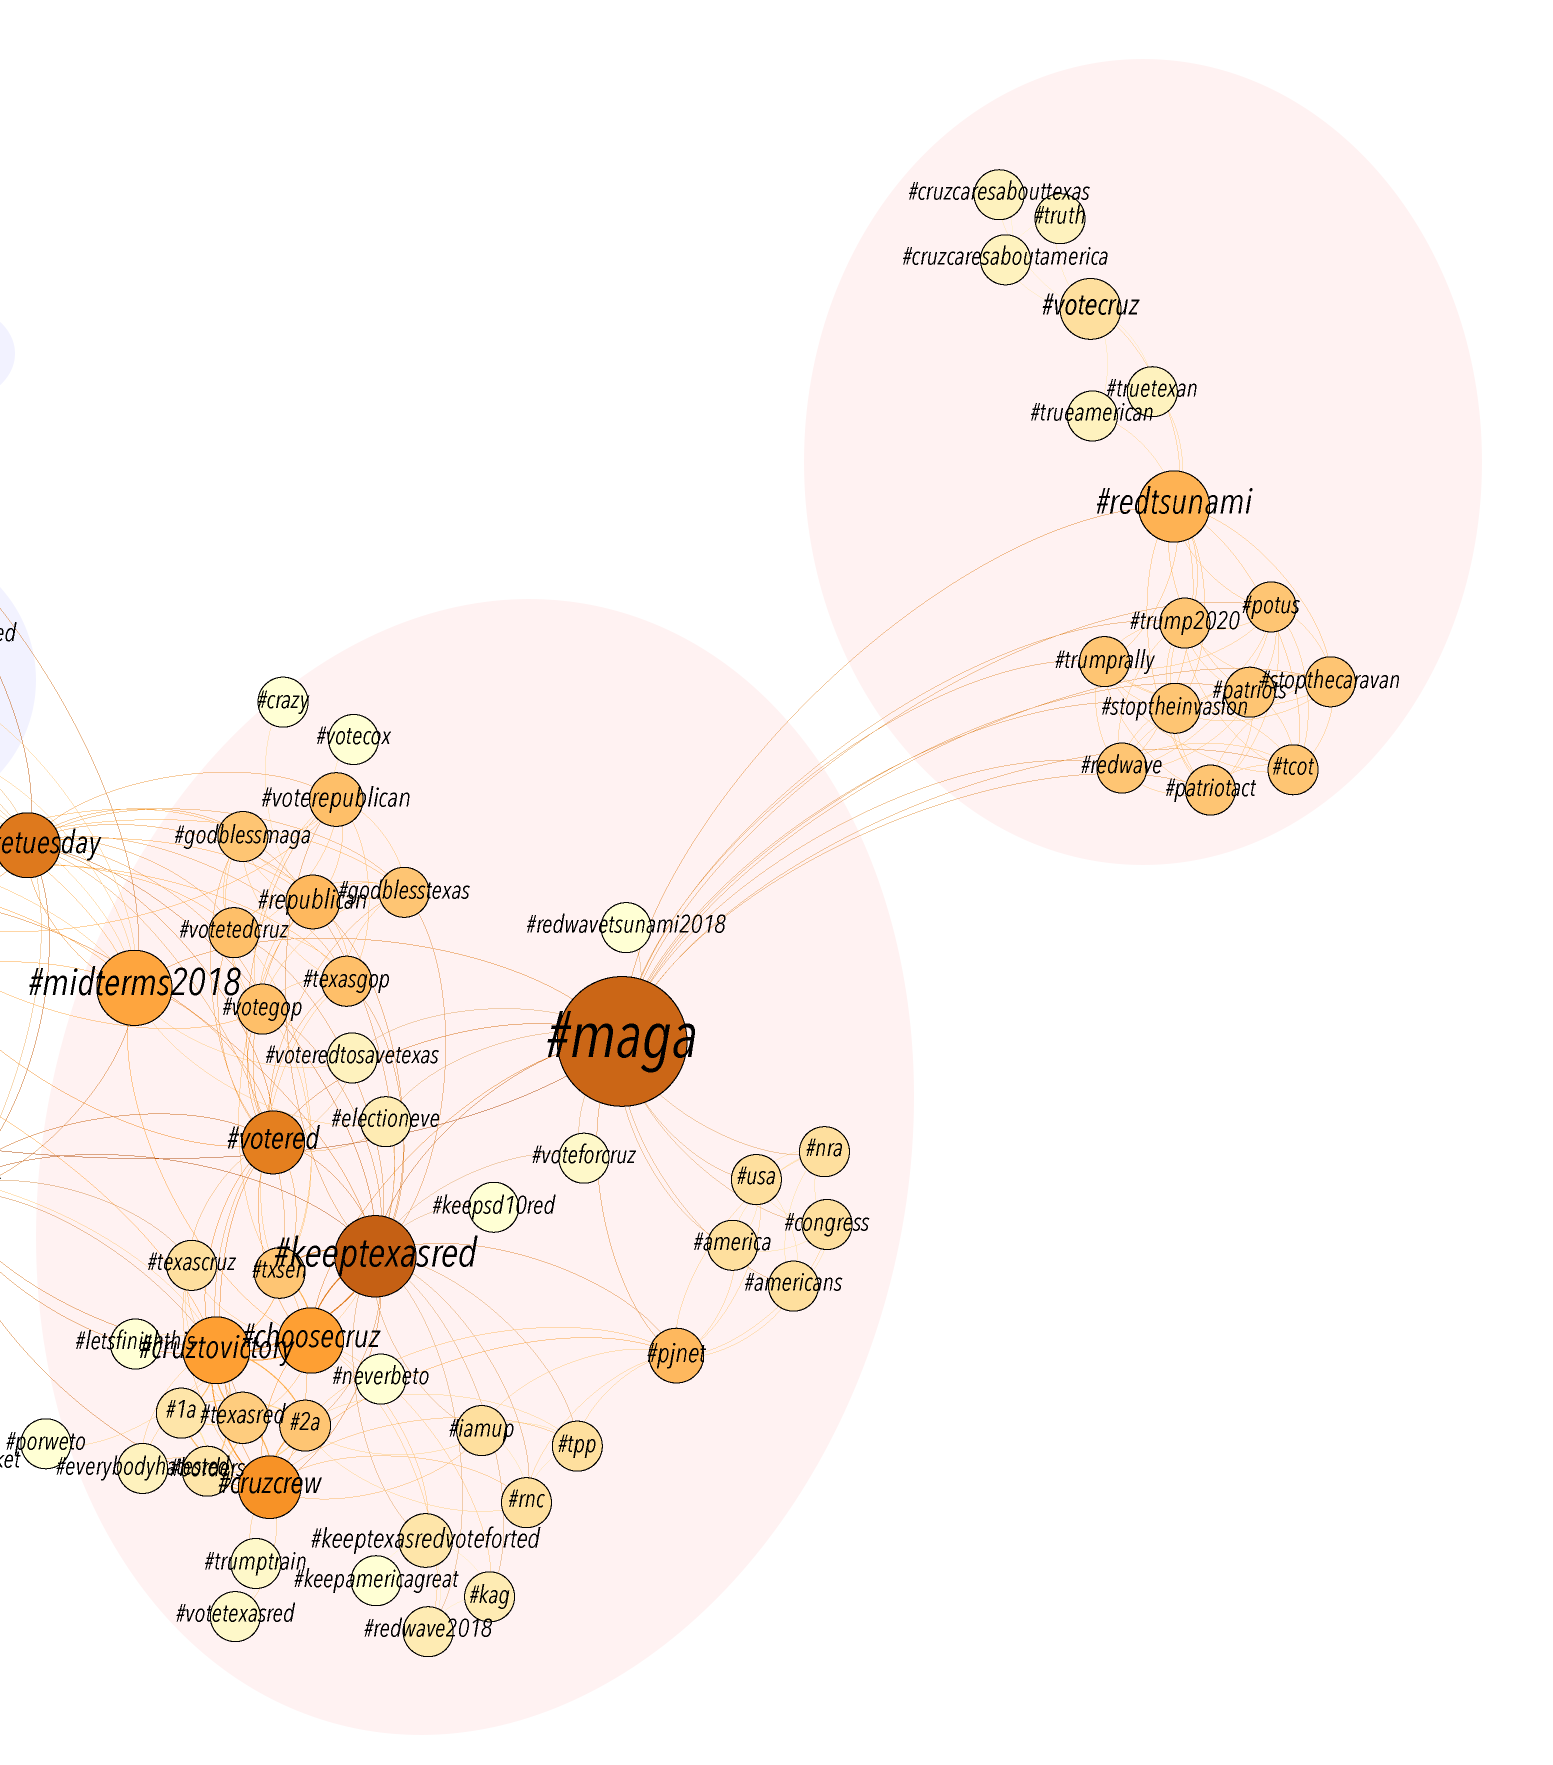
Hashtags resulting from an 18-minute search of tweets containing “Ted Cruz” or “#tedcruz.” The darker-colored nodes contain the hashtags that appeared the most frequently, and are connected to the nodes with hashtags that also appeared in the same tweets.
It took a very long time to figure out how to establish this kind of visual hierarchy through color and size but I was amazed at how Gephi could map out what looked like a mishmash of hashtags, collected through the plugin, into something observable.
I highlighted in blue and red (not through Gephi) what appeared to be hashtags coming from Democrats and Republicans, with the rest possibly going either way.
Some casual observations:
- The most prominent hashtag “on the right” is #maga, which is tweeted alongside references to Trump (#trump, #trumprally), nationalism (#trueamerican, #cruzcaresaboutamerica) and the caravan (#stopthecaravan, #stoptheinvasion).
- Meanwhile, uses of “vote” (#voteblue, #votedemocrat, #voteforamerica) dominate “on the left” side with numerous mentions of O’Rourke.
- Trump hashtags appear less than I thought they would on the left side.
- While Texas is certainly mentioned numerous times, the country as a whole is well represented on both sides, perhaps more so than usual given the current political atmosphere.
- It seems there are a bit more Democratic-leaning hashtags in this pool, though it is certainly not an indication of how many tweets the two candidates in this particular race are generating – only of tweets that include Cruz’s full name.
Limitations, questions and possibilities
In addition to the brief period of time from which the tweets were drawn, the sample of “Ted Cruz” tweets is also limited in terms of the sample of Twitter users – specifically, those who use hashtags, and of course those who mentioned Cruz. And there’s always the question of who or what is generating the tweets, and how this can determine the usefulness of the data.
I applied the timeline feature, which Micki showed in her presentation, to see the growth of the number of nodes (though it was slightly more satisfying to actually see the feature itself working). With more tweets and a longer time frame, it would be interesting to see if there are any patterns based on time of day, clumps of hashtags appearing at once (i.e. ample use in a single tweet), the increased variety of hashtags, etc.
The plugin also has the option of pulling only usernames or emojis which for this “experiement” seemed more difficult to discern patterns, or pulling everything (hashtags, handles, tweets) which when laid out on the visualization was a bit of a mess and seemed to require beyond-beginner skills to clean up. For my attempt at using Gephi, going the hashtag route seemed the easiest to manage while still producing something that could be examined.
From what I could see, using the hashtag option only returned hashtags and timestamps. Through the latter you can tell which hashtags likely appeared in the same tweet and I believe it’s visualized through the ones that appear to be grouped together. The other options in the plugin for pulling information produced more data – that helped in tracing back to the original tweets – so would provide other kinds of opportunities for analysis, as would the statistical algorithms included in Gephi.