Author Archives: Dax Oliver

HIPAA Might Not Protect You

I thought I’d just spread a little (hopefully) useful knowledge from my virtual reality research paper, both for you and your students. Here’s the GitHub link to my full paper.

First, if you or your students are using consumer tech that collects biometric or health data, like FitBit or Garmin (or virtual reality), then HIPAA (the Health Insurance Portability and Accountability Act) generally does not cover you. There are ongoing legal challenges to this, but as of now, these companies are allowed to do almost anything they want with data about your heart rate or sleep patterns, within the parameters of their user agreements. The Supreme Court has repeatedly upheld the “third-party doctrine,” which means that if you voluntarily give up data to a third party then you cannot expect that data to remain private. Fortunately, the third-party doctrine doesn’t apply to anyone 12 years old or younger, thanks to the Children’s Online Privacy Protection Act. Once you turn 13, though, it’s pretty much open season.

Second, data can only be anonymous up to a point. For example, the New York Times recently reported on how much personal information could be discovered from anonymous location-tracking data on smartphones. Even when your identity is “removed” from the location data, if that data shows you coming and going from your house, then it’s not tough to figure out that it’s you. This data is generally for sale to anyone with enough money.

Third, advertising and propaganda are much easier to slip into virtual reality than into two-dimensional computer screens. It’s often difficult for an ad to be smoothly displayed on a computer screen – it usually seems to be flashing annoyingly or obviously separate from the site’s content. However, if you’re in a virtual 3D environment that feels like a city street, it’s natural to have billboards or advertising posters around. If another character hands you a virtual drink, it could naturally be a particular brand. These ad spaces could easily be sold to companies.

And always remember that you might have friends on Facebook, but Facebook is not your friend.

Thanks to everyone for an interesting class! If I don’t see you again, good luck with all your future studies.

Infrastructure: Fetishism and Neuroticism

After yesterday’s class, I’ve continued thinking about infrastructure fetishism. This article in the New York Times a few days ago reminds us of how many people thought the internet would bring the end of authoritarianism in China. But the Chinese government simply built its own internet and most of its citizens seem happy with it so far.

As Brian Larkin writes: “Roads and railways are not just technical objects then but also operate on the level of fantasy and desire. They encode the dreams of individuals and societies and are the vehicles whereby those fantasies are transmitted and made emotionally real.” People thought the internet was inherently disruptive, but it was actually just like other infrastructures, able to be used toward any goal.

Another example of magical thinking about the internet was brought up in class by Rob: AOL’s purchase of Time Warner in January 2000. It seemed ridiculous to a lot of people even then that Time Warner would let itself be bought by AOL, which already had an obsolete feel in the tech industry, and now it’s considered one of the worst business decisions of all time. But Time Warner was hypnotized by the latest infrastructure. Ironically, Time Warner later became a major controller of internet infrastructure through its cable business.

One of the questions in class was about the consequences of thinking about infrastructure. Magical thinking is one risk of thinking too much about infrastructure. Another is neuroticism. Years ago, a friend and I worked our way through Martin Heidegger’s “Being and Time,” which is (in a way) about trying to figure out the infrastructure of existence itself. We discussed a new 20 pages each week. However, we had to stop halfway through, because so much focus on opening up the plumbing of existence was making it too hard to function on a day-to-day pragmatic level. “What is this moment? What are these things? Who is this person? What are these thoughts?” At some point, you have to forget about infrastructure and just use it.

Network Praxis: The Works of Henry Rollins

For my network analysis praxis assignment, I decided to examine the works of a single artist. After considering several individuals [1], I settled on Henry Rollins. I thought he would be particularly good for analysis because he’s had an extremely prolific career spanning a variety of art forms.

First, I needed to decide which of Rollins’s works to analyze. Should I consider the hundreds of articles that he’s written for various magazines and newspapers? I reluctantly decided no, since I doubted that it would even be possible to collect a representative list. Should I consider each installment of his weekly radio show/podcast? Although he spends considerable energy on these, I worried that the sheer mass of them would skew the results toward a single area of his life, overshadowing the larger drift of his career. However, I did decide to include guest vocals on albums by other artists, because each of these seemed so self-contained that it might indicate a change in his overall focus. I readily admit that many people might disagree with these choices. Honestly, I might disagree with them too if I weren’t facing the difficulty of creating a viable dataset.

The actual creation and cleaning of that dataset took a number of hours. I scraped all the works listed in Rollins’s Wikipedia and IMDB webpages and put them in an Excel file. The information was not in any sort of tabular form and contained an enormous amount of duplicates and superfluous entries. It added a little frustration that I know Rollins keeps an obsessive private record of every work, performance, and appearance that he’s ever made in a massive Word file that he simply calls “The List.”

The final csv file of my dataset can be viewed here:
Henry_Rollins_(Some_Significant_Works)

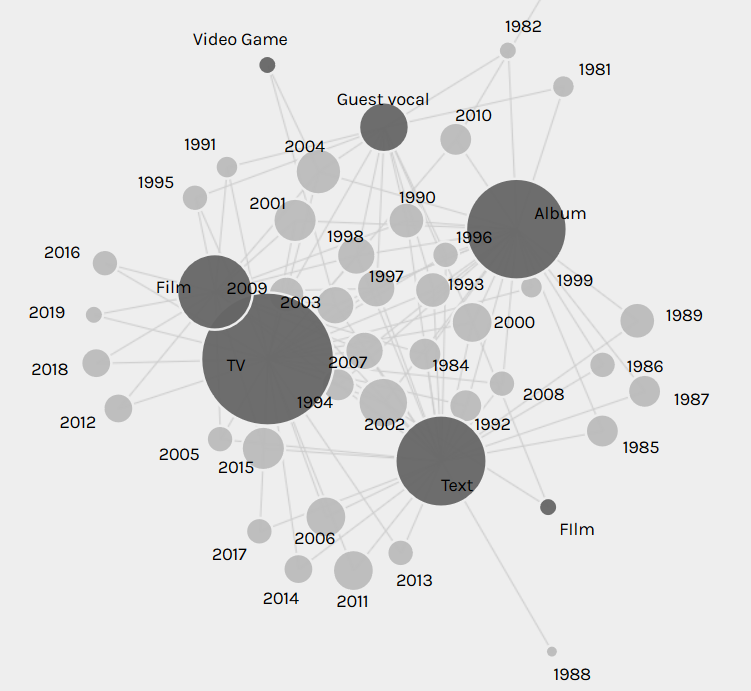
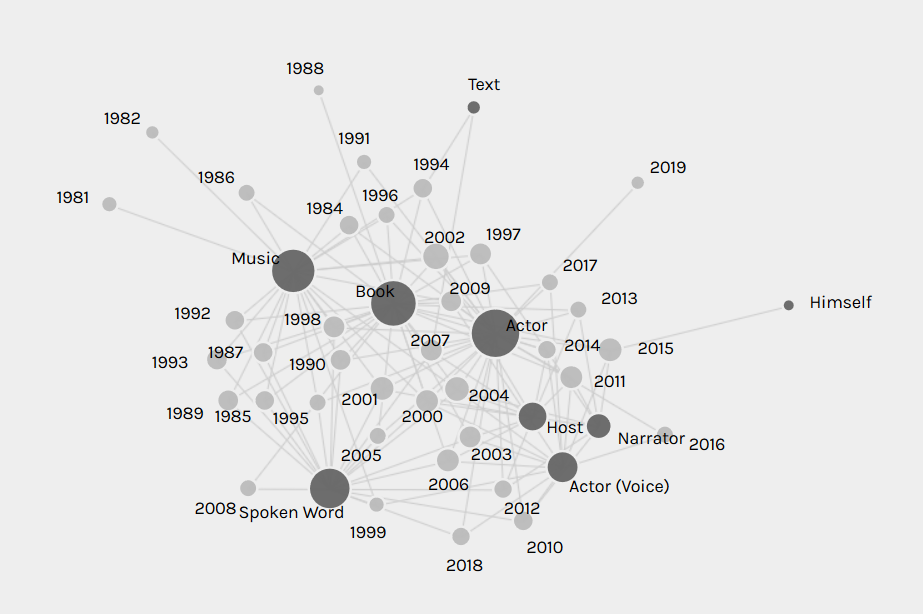
When I finished my dataset and first plugged it into Palladio, I was dismayed, because the network of art forms and years seemed to be just a chaotic jumble:

I immediately thought that a line chart of Rollins’s art forms over the years would be a better demonstration of how his focus has shifted, so I made one in Tableau:

However, after comparing the two, I realized that the Palladio network graph actually demonstrated the flow of his career better than the line chart. It only seemed chaotic at first because I wasn’t used to network graphs. His career flow is even more evident when networking media formats over the years:

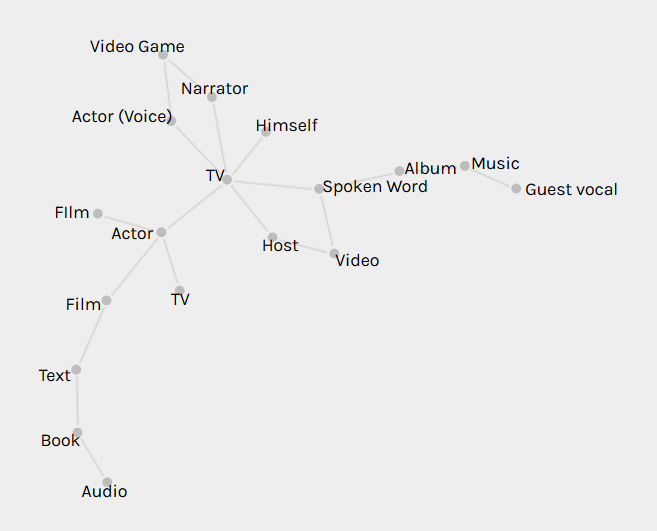
As the above network graphs show, Rollins has shifted from being primarily a musician and author in his twenties and thirties, to focusing on spoken word performance and acting in his forties and fifties. I originally thought that these facets of his career were islands floating independently of each other, until I networked art forms with media formats:

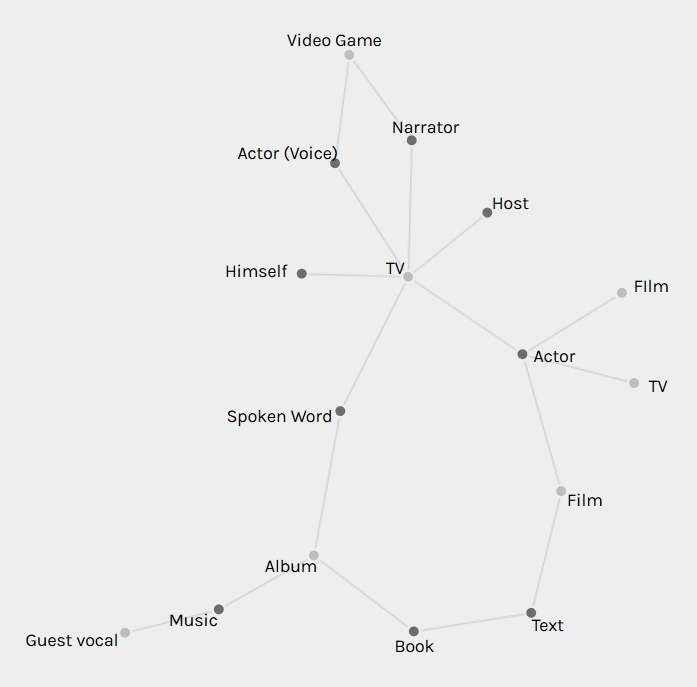
The above graph became even more revealing when I realized that “video” should really be combined with “TV” and that “audio” should be combined with “album”:

This network graph shows that all of Rollins’s shifts over the years, despite seeming isolated in their finished forms, actually have connections. For example, his lives as an author and actor are connected through his screenwriting. His lives as a musician and author are connected through the recording studios where he created both albums and audiobooks.

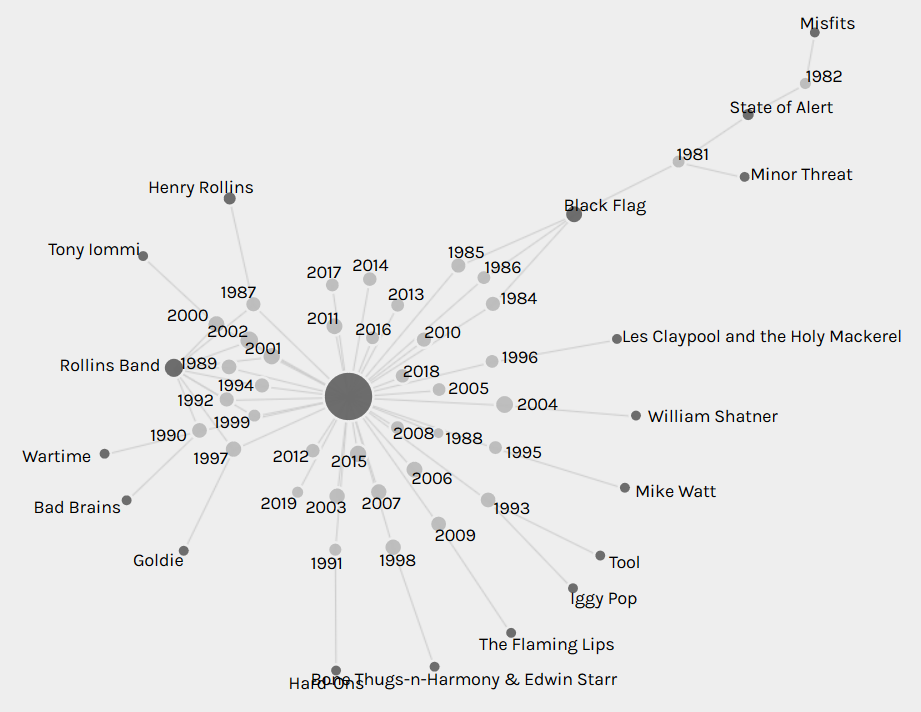
A few issues that I had with Palladio were that it sometimes seemed to create duplicate nodes (see the two “TV” and “Film” nodes in the last two graphs). When saving images of graphs through the Palladio software, the nodes were always black, so differently-sized nodes weren’t possible because the labels (also black) were often completely obscured. Palladio also sometimes created a large central pseudo-node to connect all the nodes from one column of csv data, which might give the mistaken first impression that there’s a single node connecting the other nodes:

Overall, I found Palladio and its network analysis to be an intriguing way to examine data. Although it can seem a bit jarring at first, once a viewer becomes comfortable, there are many useful connections to glean. I’d be interested in trying it out someday on Rollins’s “The List.”

[1] I first considered analyzing a single person’s podcast, since podcasts seem to be having a growing impact on public discourse. I researched various podcast csv files, but eventually moved on because comprehensive podcast data seemed beyond the scope of this praxis assignment. There are also already some very good data analyses about podcasts out there, like this one, and I didn’t want to just do another version of those.

Then I thought about John Oliver’s influential political television show “Last Week Tonight.” However, as with the podcasts, there already seemed to be good data analyses out there. I also examined the datasets available on kraggle.com and data.gov, but I was interested in doing something less overtly political for this praxis assignment after my MTA review in the last one.

Zotero Workshop – Free Citation Management Online

On October 19, I attended a Zotero workshop given by Stephen Klein of the Graduate Center library. Zotero is an online service for collecting and managing sources and citations for all your projects.

If you already know Zotero, there’s an advanced workshop on November 1.

Zotero is free and open-source, so your citations will be available even after you graduate. First register an account on zotero.org. Although Zotero is a cloud service accessible from any computer with a browser, you should download both the software and the “browser connector.”

After the browser connector is installed, a Zotero icon should appear at the top of your browser with your other browser extensions. If it’s not there, search in the extensions section of your browser menu. (On Firefox, at least. “Extensions” might have a different name on your browser.) Go into your Zotero account and create a collections folder with the name of your project. You can make as many folders as you want.

Zotero can save PDFs or any other files from websites you visit. If the online information you find is not in a PDF, Zotero will search online for an available PDF. It can also create PDFs of websites. Manual addition of offline sources is also allowed. You can search for information based on ISBN, DOI, and many other IDs. The limit on free storage is 300 MB, but you can get around this by only saving links to files on Google Docs, Dropbox, or other online workspaces.

Zotero can coordinate with Microsoft Word to create bibliographies, footnotes, or endnotes from your citations. It can automatically change the formatting to fit different styles like MLA or Chicago. You can also export your notes to Word, Excel, and other software. Notes can be written in non-Latin characters and symbols. You can share your citations with any other Zotero user.

Citations are created using metadata (notes) connected to the documents or websites. You can edit this metadata if it’s incorrect. Be sure to double-check the original metadata, because it often has mistakes or is non-existent.

If you’re using a strange computer, you can download the browser connector to add a citation to your account. Just be sure to unlink your account after you’re finished.

Text-Mining the MTA Annual Report

After some failed attempts at text-mining other sources [1], I settled on examining the New York Metropolitan Transportation Authority’s annual reports. The MTA offers online access to its annual reports going back to the year 2000 [2]. As a daily rider and occasional critic of the MTA, I thought this might provide insight to its sometimes murky motivations.

I decided to compare the 2017, 2009, and 2001 annual reports. I chose these because 2017 was the most current, 2009 was the first annual report after the Great Recession became a steady factor in New York life, and 2001 was the annual report after the 9/11 attacks on the World Trade Center. I thought there might be interesting differences between the most recent annual report and the annual reports written during periods of intense social and financial stress.

Because the formats of the annual reports vary from year to year, I was worried that some differences emerging from text-mining might be due to those formatting changes rather than operational changes. So at first I tried to minimize this by finding sections of the annual reports that seemed analogous in all three years. After a few tries, though, I finally realized that dissecting the annual reports in this manner had too much risk of leaving out important information. It would therefore be better to simply use the entirety of the text in each annual report for comparison, since any formatting changes to particular sections would probably not change the overall tone of the annual report (and the MTA in general).

I downloaded the PDFs of the annual reports [3], copied the full text within, and ran that text through Voyant’s online text-mining tool (https://voyant-tools.org/).

The 20 most frequent words for each annual report are listed below. It is important to note that these lists track specific spellings of words, but it is sometimes more important to track all related words (words with the same root, like “complete” and “completion”). Voyant allows users to search for roots instead of specific spellings, but the user needs to already know which root to search for.

2001 Top 20:
mta (313); new (216); capital (176); service (154); financial (146); transit (144); year (138); operating (135); december (127); tbta (125); percent (121); authority (120); york (120); bonds (112); statements (110); total (105); million (104); long (103); nycta (93); revenue (93)

2009 Top 20:
new (73); bus (61); station (50); mta (49); island (42); street (41); service (39); transit (35); annual (31); long (31); report (31); completed (30); target (30); page (29); avenue (27); york (24); line (23); performance (23); bridge (22); city (22)

2017 Top 20:
mta (421); new (277); million (198); project (147); bus (146); program (140); report (136); station (125); annual (121); service (110); total (109); safety (105); pal (100); 2800 (98); page (97); capital (94); completed (89); metro (85); north (82); work (80)

One of the most striking differences to me was the use of the word “safety” and other words sharing the root “safe.” Before text-mining, I would have thought that “safe” words would be most common in the 2001 annual report, reflecting a desire to soothe public fears of terrorist attacks after 9/11. Yet the most frequent use by far of “safe” words was in 2017. This was not simply a matter of raw volume, but also the frequency rate. “Safe” words were mentioned almost four times as often in 2017 (frequency rate: 0.0038) than in 2001 (0.001). “Secure” words might at first seem more equitable in 2001 (0.0017) and 2017 (0.0022). However, these results are skewed, because in 2001, many of the references to “secure” words were in their financial meaning, not their public-safety meaning. (e.g. “Authority’s investment policy states that securities underlying repurchase agreements must have a market value…”)

This much higher recent focus on safety might be due to the 9/11 attacks not being the fault of the MTA, so any disruptions in safety could have been generally seen as understandable. The 2001 annual report mentioned that the agency was mostly continuing to follow the “MTA all-agency safety initiative, launched in 1996.” However, by 2017, a series of train and bus crashes (one of which happened just one day ago), and heavy media coverage of the MTA’s financial corruption and faulty equipment, were possibly shifting blame for safety issues to the MTA’s own internal problems. Therefore, the MTA might now be feeling a greater need to emphasize its commitment to safety, whereas it was more assumed before.

In a similar vein, “replace” words were five times more frequent in 2017 (0.0022) than in 2001 (0.0004). “Repair” words were also much more frequent in 2017 (0.0014) than 2001 (0.00033). In 2001, the few mentions of “repair” were often in terms of maintaining “a state of good repair,” which might indicate that the MTA thought the system was already working pretty well. By 2017, public awareness of the system’s dilapidation might have changed that. Many mentions of repair and replacement in the 2017 annual report are also in reference to damage done by Hurricane Sandy (which happened in 2012).

In contrast to 2017’s focus on safety and repair, the 2001 annual report is more concerned with financial information than later years. Many of the top twenty words are related to economics, such as “capital,” “revenue,” and “bonds.” In fact, as mentioned above, the 2001 annual report often uses the word “security” with its financial meaning.

The 2009 annual report was extremely shorter (6,272 words) than in 2001 (36,126 words) and 2017 (29,706 words). Perhaps the Great Recession put such a freeze on projects that there simply wasn’t as much to discuss. However, even after considering the prevalence of “New York,” 2009 still had a much higher frequency rate of the word “new.” (The prevalence of “new” every year at first made me think that the MTA was obsessed with promoting new projects, but the Links tool in Voyant reminded me that this was largely because of “New York.”) Maybe even though there weren’t many new projects to trumpet, the report tried particularly hard to highlight what there was.

The recession might also be why “rehabilitate” and its relative words were used almost zero times in 2001 and 2017, but were used heavily in 2009 (0.0043). Rehabilitating current infrastructure might be less costly than completely new projects, yet still allow for the word “new” to be used. “Rehabilitate” words were used even more frequently in 2009 than the word “York.”

One significant flaw in Voyant is that it doesn’t seem to provide the frequency rate of a word for the entire document. Instead, it only provides the frequency rate for each segment of the document. The lowest possible number of segments that a user can search is two. This means that users have to calculate the document-length frequency rate themselves by dividing the number of instances by the number of words in the document. If the document-length frequency rate is available somewhere in the Voyant results, it doesn’t seem intuitive and it isn’t explained in the Voyant instructions.

Although I generally found Voyant to be an interesting and useful tool, it always needs to be combined with traditional analysis of the text. Without keeping an eye on the context of the results, it would be easy to make false assumptions about why particular words are being used. Helpfully, Voyant has “Contexts” and “Reader” windows that allow for users to quickly personally analyze how a word is being used in the text.

[1] I first ran Charles Darwin’s “Origin of Species” and “Descent of Man” through Voyant, but the results were not particularly surprising. The most common words were ones like “male,” “female,” “species,” “bird,” etc.

In a crassly narcissistic decision, I then pasted one of my own unpublished novels into Voyant. This revealed a few surprises about my writing style (the fifth most common word was “like,” which either means I love similes or being raised in Southern California during the 1980s left a stronger mark than I thought). I also apparently swear a lot. However, this didn’t seem socially relevant enough to center an entire report around.

Then I thought it might be very relevant to text-mine the recent Supreme Court confirmation hearings of Brett Kavanaugh and compare them to his confirmation hearings when he was nominated to the D.C. Circuit Court of Appeals. Unfortunately, there are no full transcripts available yet of the Supreme Court hearings. The closest approximation that I found was the C-Span website, which has limited closed-caption transcripts, but their user interface doesn’t allow for copying the full text of the hearing. The transcripts for Kavanaugh’s 2003 and 2006 Circuit Court hearings were available from the U.S. Congress’s website, but the website warned that transcripts of hearings can take years to be made available. Since the deadline for this assignment is October 9, I decided that was too much of a gamble. I then tried running Kavanaugh’s opening statements through Voyant, but that seemed like too small of a sample to draw any significant conclusions. (Although it’s interesting that he used the word “love” a lot more in 2018 than he did back in 2003.)

[2] 2017: http://web.mta.info/mta/compliance/pdf/2017_annual/SectionA-2017-Annual-Report.pdf
2009: http://web.mta.info/mta/compliance/pdf/2009%20Annual%20Report%20Narrative.pdf
2001: http://web.mta.info/mta/investor/pdf/annualreport2001.pdf

[3] It’s important to download the PDFs before copying text. Copying directly from websites can result in text that has a lot of formatting errors, which then requires data-cleaning and can lead to misleading results.
Weekly Readings

This week’s readings, particularly “The History of Humanities Computing,” made me wonder how DH is different from cultural anthropology, social psychology, or sociology. Those fields also examine the humanities by using experimental and observational methods taken from the sciences. Is the difference just a matter of self-identification?

Stephen Ramsay might have provided a possible answer in “Humane Computation,” where he writes that DH can bring “humanistic discourse” to these topics. He seems to want digital research projects to be considered new cultural objects that are open to the same critical analysis as any others. Wittgenstein Tractatus.

Ramsay also made me think about how Google has trained many people to trust algorithms almost blindly. The computer scientist Jaron Lanier has written about the problem of how many people simply accept the first few entries that Google gives them, instead of exploring further (perhaps more interesting) pages of search returns. Maybe DH can help bring that deeper data to light.

And finally: https://www.youtube.com/watch?v=PQ4o1N4ksyQ