For my network analysis praxis assignment, I decided to examine the works of a single artist. After considering several individuals [1], I settled on Henry Rollins. I thought he would be particularly good for analysis because he’s had an extremely prolific career spanning a variety of art forms.
First, I needed to decide which of Rollins’s works to analyze. Should I consider the hundreds of articles that he’s written for various magazines and newspapers? I reluctantly decided no, since I doubted that it would even be possible to collect a representative list. Should I consider each installment of his weekly radio show/podcast? Although he spends considerable energy on these, I worried that the sheer mass of them would skew the results toward a single area of his life, overshadowing the larger drift of his career. However, I did decide to include guest vocals on albums by other artists, because each of these seemed so self-contained that it might indicate a change in his overall focus. I readily admit that many people might disagree with these choices. Honestly, I might disagree with them too if I weren’t facing the difficulty of creating a viable dataset.
The actual creation and cleaning of that dataset took a number of hours. I scraped all the works listed in Rollins’s Wikipedia and IMDB webpages and put them in an Excel file. The information was not in any sort of tabular form and contained an enormous amount of duplicates and superfluous entries. It added a little frustration that I know Rollins keeps an obsessive private record of every work, performance, and appearance that he’s ever made in a massive Word file that he simply calls “The List.”
The final csv file of my dataset can be viewed here:
Henry_Rollins_(Some_Significant_Works)
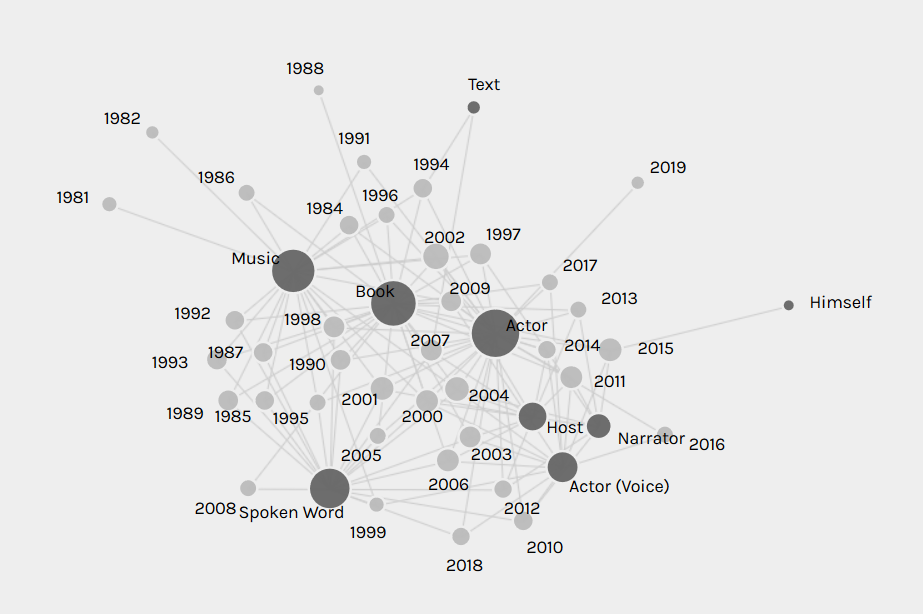
When I finished my dataset and first plugged it into Palladio, I was dismayed, because the network of art forms and years seemed to be just a chaotic jumble:
I immediately thought that a line chart of Rollins’s art forms over the years would be a better demonstration of how his focus has shifted, so I made one in Tableau:

However, after comparing the two, I realized that the Palladio network graph actually demonstrated the flow of his career better than the line chart. It only seemed chaotic at first because I wasn’t used to network graphs. His career flow is even more evident when networking media formats over the years:
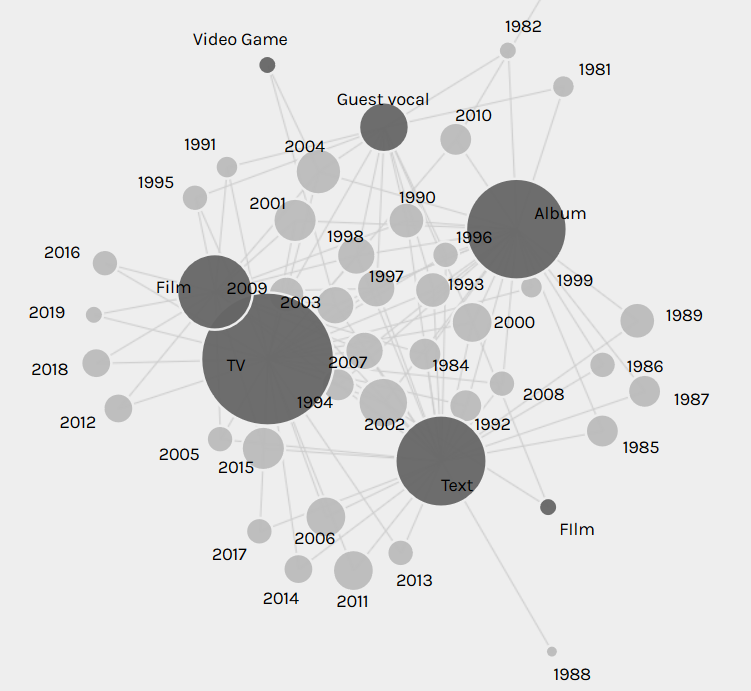
As the above network graphs show, Rollins has shifted from being primarily a musician and author in his twenties and thirties, to focusing on spoken word performance and acting in his forties and fifties. I originally thought that these facets of his career were islands floating independently of each other, until I networked art forms with media formats:
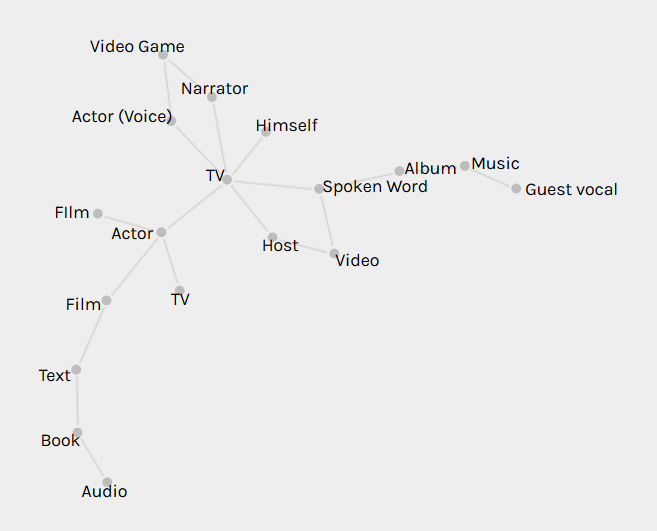
The above graph became even more revealing when I realized that “video” should really be combined with “TV” and that “audio” should be combined with “album”:
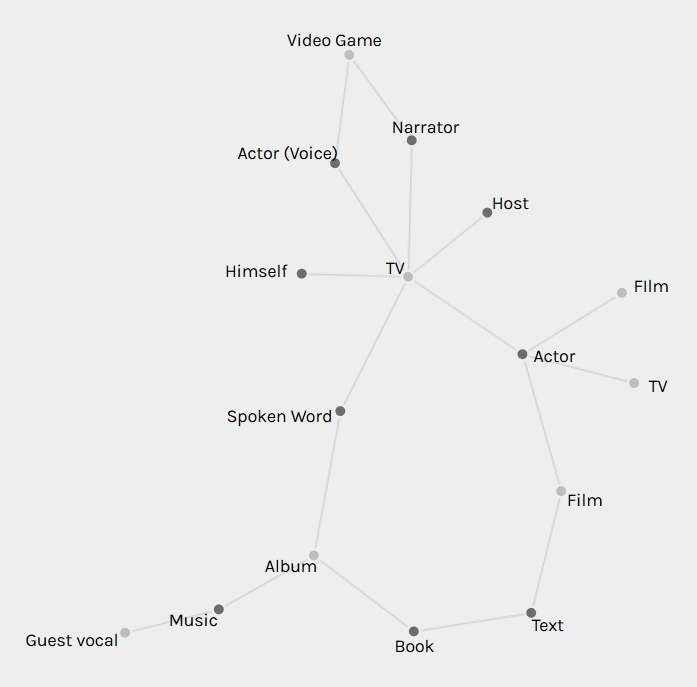
This network graph shows that all of Rollins’s shifts over the years, despite seeming isolated in their finished forms, actually have connections. For example, his lives as an author and actor are connected through his screenwriting. His lives as a musician and author are connected through the recording studios where he created both albums and audiobooks.
A few issues that I had with Palladio were that it sometimes seemed to create duplicate nodes (see the two “TV” and “Film” nodes in the last two graphs). When saving images of graphs through the Palladio software, the nodes were always black, so differently-sized nodes weren’t possible because the labels (also black) were often completely obscured. Palladio also sometimes created a large central pseudo-node to connect all the nodes from one column of csv data, which might give the mistaken first impression that there’s a single node connecting the other nodes:
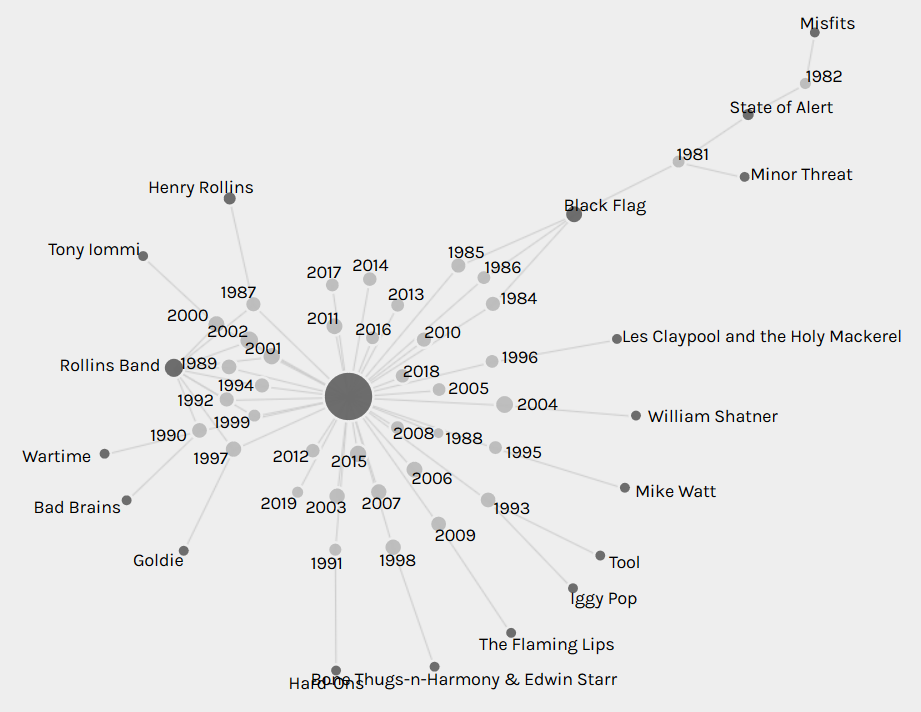
Overall, I found Palladio and its network analysis to be an intriguing way to examine data. Although it can seem a bit jarring at first, once a viewer becomes comfortable, there are many useful connections to glean. I’d be interested in trying it out someday on Rollins’s “The List.”
[1] I first considered analyzing a single person’s podcast, since podcasts seem to be having a growing impact on public discourse. I researched various podcast csv files, but eventually moved on because comprehensive podcast data seemed beyond the scope of this praxis assignment. There are also already some very good data analyses about podcasts out there, like this one, and I didn’t want to just do another version of those.
Then I thought about John Oliver’s influential political television show “Last Week Tonight.” However, as with the podcasts, there already seemed to be good data analyses out there. I also examined the datasets available on kraggle.com and data.gov, but I was interested in doing something less overtly political for this praxis assignment after my MTA review in the last one.


