Author Archives: Rob Garfield

Project T.R.I.K.E. — Triple the fun!

A third reminder about our project. Check Nancy and Hannah’s posts here.

Many of our readings, and other readings that these have pointed to, have referred to issues Digital Humanists have in finding and working with data. Occasionally, the authors of these readings have made explicit calls for more humanities datasets in general, while some have focused on issues with using data in research and pedagogy. It is probably important to observe that there are a wide range of notions as to what constitutes data for the discipline, including, most broadly, the internet itself, or the entirety of content on social media platforms, but often referring to material that has been digitized and made available as “unstructured data” on the internet. The latter comes in the form of e-texts, images of photos, art and text, video, and etc.

There is an important distinction between data that is collected through experiment or exists already in a form delineated as computationally interrogatable, and what humanists generally designate as objects of study — which tend to have prior significance in their own cultural domains.  Humanistic “raw data” (a troubled term) is functionally transformed when it is viewed as data.

As Miriam Posner writes, “When you call something data, you imply that it exists in discrete, fungible units; that it is computationally tractable…”, (Posner, “Humanities Data”) but notes that for most humanists, the “data” that is used is only “computationally tractable” to the extent that it arrives in digitized form; that, say, a film comes to us as something that can primarily be understood as it is observed across its visual, aural (often), temporal and cultural dimensions, whereas what is generally considered as data to a scientist might take the form of a list of each of the film’s frames.

Clearly, this concept implies the need for an additional step in the process of converting digitized culturally-significant objects into data that can be analyzed computationally. Thus, the problem of transforming data objects of interest to a digital humanist, e.g. a digitized novel, a collection of images of an historical correspondence, into a such a form, while not unique to the digital humanities, is certainly fundamental to any digital humanities project that analyzes data.

Posner’s article goes on to describe how this distinct relationship to data troubles the humanities around issues of computational research:

There’s just such a drastic difference between the richness of the actual film and the data we’re able to capture about it…. And I would argue that the notion of reproducible research in the humanities just doesn’t have much currency, the way it does in the sciences, because humanists tend to believe that the scholar’s own subject position is inextricably linked to the scholarship she produces. (“Humanities Data”)

But she does recognize the importance of being able to use quantitative data. One of her students engaged in art history research on the importance of physical frames in the valuation of art in the late 17th through the 18th century. He was able to make a statement about the attractiveness of “authenticity” based on an analysis of sales records, textual accounts and secondary readings. Posner concludes, “So it’s quantitative evidence that seems to show something, but it’s the scholar’s knowledge of the surrounding debates and historiography that give this data any meaning. It requires a lot of interpretive work.” (“Humanities Data”)

The problematics of humanities data Posner identifies include:

  • the open availability of data, i.e. conflicts with publisher pay walls and other kinds of gating
  • the lack of organized data sets to begin with and the difficulty of finding what data sets have been released
  • the fact that humanities data is generally “mined”, requiring specific tools both for mining and organizing what is mined
  • the lack of tools for (and/or datasets that include the tools for) modeling the data in the ways appropriate to specific inquiry given a humanist’s understandable lack of experience with manipulating data

Our own praxis assignments in the Intro to Digital Humanities class, have brought us face to face with these problematics.  We were tasked, with the aim of exploring digital humanities praxis more generally, to create our own inquiries, find our own data, “clean” said data, use a specific methodology for transforming/visualization it, and then use these transformations to address our original inquiries.  If we started with an inquiry in mind, we had to find suitable data that promised to reveal something interesting with respect to our questions, if not outright answer them. We also had to wrangle the data into forms which could be addressed with digital tools, and then make decisions about what it means, given our goals, for data to be “clean” in the first place. In so doing we ran into a number of other issues, such as: what is being left out of the data we have identified? What assumptions does the choice of data make? What reasonable conclusions can we draw from specific methodologies?

As James Smithies writes in Digital Humanities, Postfoundationalism, Postindustrial Culturedigital humanists tend to regard their practice as “a process of continuous methodological and, yes, theoretical refinement that produces research outputs as snapshots of an ongoing activity rather than the culmination of ‘completed’ research”.  (Smithies) Using that idea as a springboard, it seems fair to posit that humanists often adopt an attitude towards data that does not halt the processes of interpretation and analysis at the point when the data’s incompleteness and necessary bias is discovered but will seek to foreground the data’s unsuitability as a point of critique — and thus incorporate it into the conclusions of the theoretical work as a whole.

An example from our readings of this sort of thing done right is Lauren Klein’s article The Image of Absence wherein she recounts the story of a man (a former slave of Thomas Jefferson’s), of whom little trace remains on record, by looking at his absence in the available sources (primarily a set of correspondence) and, in so doing, reconstructs the social milieu that contributed to his erasure. What is especially exciting about Klein’s work is how she maintains her humanistic orientation — which enables her to use data critique as a vehicle for forming a substantive statement. Indeed, this is a wonderful example of turning the very fact of a data set’s incompleteness into a window on an historical moment, as well as choosing the right visualizations to make a point, and focusing on what is most important to humanists, the human experience itself.

It was clear to us that to complete projects of this scope responsibly, and with a similar impact as Lauren Klein’s work, not only requires a significant time investment, but also specific skills. Our class provided us with a generalist’s knowledge of what skills a complete digital humanities project might require, but it was beyond the scope of the class to train us in every aspect of digital humanities praxis.  

Project T.R.I.K.E. is thus designed to support students who might lack some of the skills necessary to contend with digital humanities praxis by providing them with practical references and their instructors with the tools to focus on domains that fit with the pedagogical goals of their classes and institutions.  It is important to note we don’t participate in a methodological agenda — in other words, it is not our goal to prescribe pedagogy, but to support it in all its reasonable forms.

Machine Bias

https://www.propublica.org/article/machine-bias-risk-assessments-in-criminal-sentencing

I just wanted to bring the above article into our discourse.  I apologize for adding it so late in the week.

It covers a set of algorithms designed to estimate recidivism risk in convicted criminals for consideration in sentencing and parole calculations.  Without knowledge of a subject’s race, nor by asking questions to determine a subject’s race, the algorithm has been shown to significantly overestimate recidivism for black convicts while significantly underestimating the same for white convicts.

The fact that the algorithms were designed and owned by a private company brings to light all we are reading and thinking about algorithmic transparency, the economic motivations to resist said transparency, and how bias can be perpetuated more easily without it.

Digital Praxis #2: Python and Mapping On the Road

This praxis write-up is going to focus on the technical, getting data and rendering it.  I do think there needs to be a purpose behind the mapping that is well spelled out both pre- and post-.  This being an exercise, however, and the technical aspects taking so much time, I am going to treat mostly with the technical and logistical aspects of my efforts in this post.

Fits and Starts:

My first hazy idea was to map all the birthplaces of blues musicians and “thicken” them temporally, then add similarly mapped studios that produced their records — to see if there were interesting trends there.  I found getting the data I wanted resistant to quick searches, so I started thinking about other things I might want to do.

Next up was mapping Guevara’s route in The Motorcycle Diaries.  There are already a few resources out there that have done this, so I could check my work.  Further, the book has a trip outline conveniently located before the work’s text. Easy. So, I opened an ArcGIS storymap and went to work, first mapping all the routes from the outline, then deciding to add text from the novel to the main points.  When I started to read the text, however, I encountered much more density of spatial references than in the outline, so I added more points and began, intuitively, to transfer the entire text of the memoir into the map. What I ended up with was the idea of a new version of the book which could be read in the text window while the map frame would move to the location of each entry.  This was labor intensive. For one thing, it required that I read the book again from beginning to end, not for the content so much as the setting of the content. I started to feel that it would take a very long time to do this for even a short book, and that it was not interesting enough to justify such labor without a distinct purpose for doing it. So, I did it for the first few chapters as a proof of concept and then moved on.  

Link to the story map

Praxis #2 — the real effort

Kerouac’s On the Road, might be the most iconic travel narrative in 20th century American Literature.  And, sure enough, many people have mapped the trip routes over the years. So, I knew there would be data out there, both for thickening my maps and comparing my findings to others’.  

Methodology:

Data:

From my first attempts, it was clear that getting data is a problematic for all mapping projects.  The labor involved in acquiring or generating geospatial data can be overwhelming. I can’t remember which reading this week touched on all the invisible work that goes on, mostly in libraries, to create large datasets, (“How to Lie with Maps”, I believe), but, again, it is clear that such work is to be respected and lauded.  It was my intention, then, to look at ways in which data can be extracted from texts automatically — as opposed to the way I was doing it with the Guevara text — thus cutting out a huge portion of the effort required. I was partially successful.

Process:

I’ve been wanting to improve my Python skills, too, so I started there.  (here is my GitHub repository)

  1. I set up a program in Python to load up the text of On the Road.  This first part is simple.  Python has built in libraries for pulling in files and then addressing them as raw text.
  2. Once I had the text in raw form it could be analyzed.  I researched what I needed and imported the geotext package because it has a function to pull locations from a raw text.
  3. Pulling the locations into a geotext class allowed me to look at what geotext saw as the “cities” invoked by Kerouac in the novel.
  4. This list of city names pulled every instance from the text, however, so I ended up with a list that had many duplicates in it.  Fortunately, Python has a built in function (set()) which returns an unordered set of all the unique items in a list. It being unordered, however, meant that I couldn’t iterate over it so I used the list() function to turn the set of unique city names back into a useable list.  The figure ends up looking like this:
    1. list(set(location.cities))
  5. City names are just names (strings), so I needed to somehow grab the latitude and longitude of each referenced city and associate them with the city name.  I went through an extended process of figuring out the best way to do this. Intuitively, it seemed like a master list, where city names and coordinates were joined, was the way to go.  It probably is, but I found it difficult, because of my unfamiliarity with the libraries I was using, to get everything to work together, so:
  6. I imported the geopy package and ran through the unique list mapping each name to its geospatial coordinates (see Error below).  I used the simplekml package to take the name and the coordinates to create a new “point” and then saved the resulting points into a *.kml file.  
  7. I had to add some simple error checking in this loop to make sure I wasn’t getting null data that would stop the process in its tracks, so I added an “if location:” check since geopy was returning null if it couldn’t find coordinates for an entry in the unique list of city names.
  8. So now I had points with only name and coordinates data.  I wanted descriptions in there, too, so I imported the nltk package to handle finding the city names in the raw text file and pulling in slices of text surrounding them.
  9. The slices look goofy because the basic slicing process in Python uses characters rather than strings.  (Note: I’m sure I could figure this out better.) So I appended ellipses (‘…’) to the beginning and end of the slices and then assigned them as the “description” of each simplekml point. (Note: I wanted to error check the nltk raw text find() function, too, which returns a “-1” for the location if it doesn’t find the entered term–so I did)
  10. I then pulled the kml file into a Google map to see the results.

Error:

First off, it worked.  I was able to generate an intelligible map layer with a set of points that, at first glance, seemed reasonably located.  And the descriptions included the city names, so that did not fail either.

Link to initial map

But there are many issues that need to be addressed (pun intended).  There are multiple “bad” points rendered. I had already imagined avenues for bad data generation before viewing:

  • That a person’s name is also a city or place  — e.g. John Denver, Minnesota Fats
  • That a city pulled by Geotext fails to find a location in geopy — fixed by error checking
  • That a place that is not a city has a city’s name (see below)
  • The beginning of a multi-word city name is the complete name of another place (e.g. Long Island City)
  • That surrounding text (bibliographies, front matter, page notes, end notes, etc.) would have place names in them — addressed by data cleaning
  • That many cities share the same name — requires disambiguation

Examining the points, I found a number of specific issues, including, but not limited to:

  • “Kansas” as a city
  • “Same” is apparently a city in Lithuania
  • “Of” is apparently a town in Turkey
  • “Mary” in Turkmenistan
  • “Along” in Micronesia
  • “Bar” in Sydney’s Taronga Zoo
  • “Sousa” in Brazil
  • “Most” in the Czech Republic
  • Etc….

So, how to deal with all of this?  I ran out of time to address these things in code.  I would have to think more about how to do this, anyway. But here is what I did next on the map.

At https://www.dennismansker.com/ontheroad.htm, Dennis Mansker has already put up maps of the 4 “trips” recounted in On the Road.  At first I just thought it would be interesting to add those as layers to my map of city name mentions.  As it turns out, the new layers gave me a clear visual of potentially problematic points.

I included all 4 maps from Mansker’s site and then plotted contemporary driving directions (DD) over them.  Looking at the map with all the layers active reminds me of looking at a 2D statistical plot with the median (multiple medians) drawn in.  It reduced the number of points I needed to address as potential errors. Any point that fell near the DD lines, I could de-prioritize as likely “good” data.  All the points surrounded by space were then easily interrogatable. This way, I discovered that the text file had not been sufficiently cleaned this way — finding a point in Japan, for instance, that corresponded with the Japanese publishing house for this edition.  And I was also able to quickly see what cities Kerouac named that were not part of the “travelogue” — where he was not physically present. This could lead to some interesting inquiries.

Link to final map

More Thoughts:

I really like the idea of automating the process of data generation.  Obviously, there are many ways what I did could be improved, not limited to:

  • A deep dive into reducing error — i.e. the production of “bad” points
  • Adding facilities to take texts as inputs from the person running the program so potentially any text could easily be analyzed and converted
  • Adding facilities for looking at other geospatial data in a text
  • Improving the text slicing mechanics to get more polished and applicable passages from the text into the map.
  • Right now, the algorithm looks up only the first instance of a city name in the text; it would be great if it could pull in all instances (not too hard)

Getting the data and cleaning it for the purposes is a huge issue, one that dominated my efforts.  I’ve left quite a bit of bad points in the map for now to illustrate the issues that I faced.

Google Maps is an easy tool with which to get going, but there are some restrictions that I encountered, namely, limited options for visualizing the points.  I wanted control over the size of the icons, in particular. I would have used ArcGIS, given its power, but my kml files would not load into it. There is a huge learning curve for ArcGIS — as well as a paywall.  In the future, I hope to be able to explore the mapping softwares with a bit more depth and breadth. It really helps, as in most cases, to have a goal/project to use as a vector into these complex softwares in order to begin “learning” them.


Fire the Canons: Ramsay’s Screwing Around

From the initial paragraphs of Ramsay’s The Hermeneutics of Screwing Around, I expected this article to be about how the massive uptick in availability of digital texts and modes of information access has affected the landscape of the canon™.  As Ramsay writes, “What everyone wants—what everyone from Sargon to Zappa has wanted—is some coherent, authoritative path through what is known.”

As a poet, my reflex perception of the canon is not as a guide to reading, but as an expression of cultural power.  Who gets lauded, who gets read and whose lens is authoritative?  When I was an undergrad, I innocently appreciated the guiding principle of a body of great works; since then, however, I’ve felt alienated by it, pressured by it, far more than guided by it.

In the discussion of two modalities of research Ramsay highlights, search and browsing, there is no mention of what texts are discoverable. What are the power dynamics resident in their preservation, digitization and availability?  This question doesn’t change just because there is so much more data available. Further, what lenses are guiding our inquiries? What questions are we asking?  What led to us asking these questions? What are we interested in and why? How does authority manifest itself in the possibility space of inquiry in general? If history is written by the winners, and culture is grooved by authority, who are we anyway?  Are we always defined in relation to our canons?

To the extent that we have freedom of choice, we can decide to browse into elements that are defined as relatively “off the beaten path”.  Zappa can look for Varese. And Varese’s obscurity, I’m sure, formed no small part of his interest. But once we take the prismatic course of browsing, we come under the authority of search engines and availability, Google’s black box search engine, conditioned by the behavior of anonymous others, and unreported pay schemes to foreground certain sites and data, entities like JSTOR who shutter crucial information behind a pay wall, etc.  So much more data is available now, it’s true — and iI’s nice to have “choice”, for sure — but we do have to recognize that the possibility space of said choice is limited by many forces beyond our immediate perception and control.

I love screwing around on the internet, pursuing one thing only to be surprised by another and changing direction — exposing myself to things I would never have run across in a directed search.  I believe the Situationists called this derive.*  It’s now my main mode of inquiry; and this might be true for most people who spend time on the internet.  But to consider the derive as transforming one’s relationship to the canon would be a bit too optimistic a claim.

I realize, too, that what I’ve written about here is beyond the scope of Ramsay’s article — which sidesteps debate about canon-formation and boils down to an epistemology of research modalities.  I want to end by saying I love reading Ramsay; like Carolyn, I appreciate his style and clarity. I’m trying to read the entirety of Reading Machines right now and keep stopping to soak in the pleasure of a new idea.

*Edit: I do want to note that the Situationists were very aware of the limits of serendipity in the derive, incorporating a recognition of what contraints are present even as we “screw around”.

Text Mining Praxis: Remember the Past? Or Find Lost Time?

I start with a provocation from Ted Underwood in answer to his own question of whether it is necessary to have a large collection of texts to do text mining (well, distant reading, really):

This is up for debate. But I tend to think the answer is “yes.”

Not because bigger is better, or because “distant reading” is the new hotness. It’s still true that a single passage, perceptively interpreted, may tell us more than a thousand volumes.

But if you want to interpret a single passage, you fortunately already have a wrinkled protein sponge that will do a better job than any computer. Quantitative analysis starts to make things easier only when we start working on a scale where it’s impossible for a human reader to hold everything in memory. Your mileage may vary, but I’d say, more than ten books? (Underwood, “Where to start with text mining”)

Naturally, my text mining investigation transgresses this theory and, ultimately, doesn’t disprove it.

At first, I wanted to compare translations of Rimbaud’s Illuminations, the first by Wallace Fowlie and the second by John Ashbery.  I wasn’t able to easily get the latter in digital form, so I looked at a set of corpora I had “lying around” and chose to do the same with translations of Proust I found in my digital desk drawer.

The canonical translation of A La Recherche du Temps Perdu was, for many years, the C.K. Scott Moncrieff one.  More recently, Terence Kilmartin reworked the Moncrieff translation. And then D.J. Enright reworked Moncrieff in light of the Kilmartin translation.  In the process, the translated title “Remembrance of Things Past” became “In Search of Lost Time”.

In attempting to avoid lost time myself, I chose to render just the first volume Swann’s Way (in both).

Clearly this is not ten texts, but I am very interested in whether empirical investigations into different translations of an individual work can uncover interesting information about translation in general; and many other questions about translation that I certainly don’t address here.  Here is just a start.

Methodology:

I started with an html file of Enright’s translation of Swann’s Way, copied it into a plain text file and started to clean it manually.  This involved removing a bunch of text from the beginning and end. I did the same for the Moncrieff translation, except I had an epub file of that which I converted to plain text using an online conversion tool.  The Moncrieff translation had separated the Place Names: the Name section from the end of the Enright file, which was better left off anyway.

I made the assumption that this process wasn’t introducing any error that wasn’t already in the texts as I got them.  If I were doing this for an actual study, I would not make that assumption.

My first thought was to try to reproduce the methodology of a Stanford group that had compared translations of Rilke’s The Notebooks of Malte Laurids Brigge.  This would have required me to use two tools, Python NLTK to “tokenize” the texts into sentences and then Stanford’s Lexical Parser to analyze them syntactically.  As I sat down to do this this weekend, away from home in the cold north with family and under conditions of intermittent and slow internet, I realized the time investment was beyond the scope of a weekend.  Syntactic analysis is thus a huge gap in my efforts — and was really what I was interested in initially.

Coming back home, I decided to see what I could do with Voyant.  So I used the upload function from the Voyant-tools landing page and selected both texts (separate plain text files), then clicked the circus-like “Reveal” button.

There were a lot of proper names and a few other terms (such as “swann”, “odette”, “mme”, etc.) that I didn’t think were useful, so I used the options button in the Cirrus tool to add “stop words” to filter them out and then applied that filter globally.

I used the Summary for a lot of my statistics because it was the clearest spot to see big picture comparisons between the texts.  I also explored every tool available, switching them into and out of display panes. For my purposes, the most useful were Document Terms, Trends, Summary, and Terms.  I think I could have used Contexts more if I were asking the right questions. The Reader did not help much at all because the corpora were listed one after the other rather than side by side.

I also consulted with WordNet to come up with words that surrounded the concept of remembering and memory.  I did not see a way to do this, or invoke outside help, from within Voyant, so I just went to the source.

The Reveal:

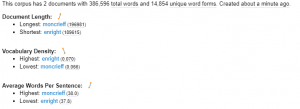
One thing that jumped out is the total word count comparison.  Moncrieff uses 196981 words to Enright’s 189615 — a difference of 7366 words, or 3.8% more words in Moncrieff than Enright.  At the same time Enright’s vocabulary density is consistently higher, 0.4% over the course of the novel and 0.7% in the Overture itself.  This suggests that Enright’s translation is more economical — dare I say “tighter”?  Of course, the semantic richness of the two texts and how closely they “capture” the original are not questions these stats answer.

Doing some simple math by dividing the total number of words by the average sentence length (why doesn’t Voyant just give the actual # of sentences?), shows that Moncrieff has about 5184 sentences to Enright’s 5016.  Given that Enright’s average sentence size is shorter, he has clearly not increased the length of his sentences to “fit in” the extra clauses/phrases that Moncrieff uses. Does this mean he is leaving things out? Or is it further evidence of Enright’s greater efficiency?  If one is translating sentence for sentence from the original, how does one end up with such a discrepancy of sentences (168 difference) without combining them? Unfortunately, I don’t immediately see a way of answering this question from a distance.

Comparing the two texts for word frequency for the top words didn’t show much difference.  However, the differences are magnified by the relative word counts of the corpora. For example “time” — a crucial word for the work — looking for it in the “Document Terms” tool shows that it occurred 429 times in Enright to 420 for Moncrieff, but dividing by approximate sentence count, shows “time” occuring at a rate of about 0.086 per sentence in Enright whereas Moncrieff’s per sentence frequency of “time” is about 0.081.  Projecting Enright’s frequency to the length of Moncrieff’s text, we would get about 446 instances of “time” in the later translation, which is 1.06 times as much as the earlier translation.

Let’s look then at the ways “time” can be used.  There is some ambiguity to the word “time” which can be fun but obfuscating.  Given “time”s ambiguity, I wondered if perhaps the additional uses of it indicated something less precise in Enright.  So I looked at the text itself in a few spots.

I didn’t think I was going far afield to grab “time” and drill down with the word.  Not only does it have a lot of vectors of meaning and ways to be used, but it is central to the theme of the whole work (i.e. Remembrance of Things Past, In Search of Lost Time).  Seeing how it is invoked by the two translators could tell us a lot about how they see “time” operating in the work as a whole.

Comparing the first paragraphs of the two texts:

Enright:

For a long time I would go to bed early. Sometimes, the candle barely out, my eyes closed so quickly that I did not have time to tell myself: “I’m falling asleep.” And half an hour later the thought that it was time to look for sleep would awaken me; I would make as if to put away the book which I imagined was still in my hands, and to blow out the light; I had gone on thinking, while I was asleep, about what I had just been reading, but these thoughts had taken a rather peculiar turn; it seemed to me that I myself was the immediate subject of my book: a church, a quartet, the rivalry between François I and Charles V. This impression would persist for some moments after I awoke; it did not offend my reason, but lay like scales upon my eyes and prevented them from registering the fact that the candle was no longer burning. Then it would begin to seem unintelligible, as the thoughts of a previous existence must be after reincarnation; the subject of my book would separate itself from me, leaving me free to apply myself to it or not; and at the same time my sight would return and I would be astonished to find myself in a state of darkness, pleasant and restful enough for my eyes, but even more, perhaps, for my mind, to which it appeared incomprehensible, without a cause, something dark indeed.
I would ask myself what time it could be;

Moncrieff:

FOR A LONG time I used to go to bed early. Sometimes, when I had put out my candle, my eyes would close so quickly that I had not even time to say ‘I’m going to sleep.’ And half an hour later the thought that it was time to go to sleep would awaken me; I would try to put away the book which, I imagined, was still in my hands, and to blow out the light; I had been thinking all the time, while I was asleep, of what I had just been reading, but my thoughts had run into a channel of their own, until I myself seemed actually to have become the subject of my book: a church, a quartet, the rivalry between François I and Charles V. This impression would persist for some moments after I was awake; it did not disturb my mind, but it lay like scales upon my eyes and prevented them from registering the fact that the candle was no longer burning. Then it would begin to seem unintelligible, as the thoughts of a former existence must be to a reincarnate spirit; the subject of my book would separate itself from me, leaving me free to choose whether I would form part of it or no; and at the same time my sight would return and I would be astonished to find myself in a state of darkness, pleasant and restful enough for the eyes, and even more, perhaps, for my mind, to which it appeared incomprehensible, without a cause, a matter dark indeed. I would ask myself what o’clock it could be;

  • Time 1: “For a long time” — a temporal period with some vagueness
  • Time 2: “I did not have time” — time as a resource in which to accomplish a goal
  • Time 3: “the thought that it was time to go to/look for sleep” — a discrete moment suggesting a demand
  • Time 4: “I had been thinking all the time, while I was asleep” — only in Moncrieff, vague use of a temporal period, perhaps rendered better in Enright’s interpretation “I had gone on thinking, while I was asleep,” which feels more accurate to the process described.
  • Note: I’m leaving out “sometimes”

Nothing here indicates a lack of precision on Enright’s part.  Indeed, his paragraph reads better, is more modern and succinct.

Over and over as I looked at statistics, contexts, and collocations, I found that being able to look at the texts “side by side” was crucial if I wanted to investigate something, or test a theory.  I didn’t believe that Voyant was showing me what I wanted to see, but was leading me to things that I might want to look at more closely. I’m sure that my close reading bias is an influence here — but Underwood’s provocation continues to loom.

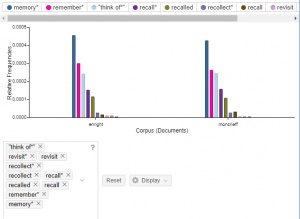
Riffing on this, I thought perhaps I could look at the way the two authors approach the concept of memory — perhaps the most important theme of the entire work.  This time (pun intended), I was working from a concept rather than a particular word. So, in lieu of having a way to look at a concept in Voyant directly, I pulled a set of terms from WordNet around the idea of “remembering”, such as: recall, remember, revisit, retrieve, recollect, think of, think back, etc.  I then added “memory” to the mix and fed the set of terms into the trend tool. I noticed that the search field would dynamically take my search term and return me the option of, say, “remember” and “remember*”. “Remember*” seemed to look for words with “remember” as a root. Phew. So I didn’t have to include past forms like “remembered”.  

I’ll include the graph, but the upshot is that the distribution of these words was very close in the two translations as well as the total use of the concepts.  Again, I had to do some extra math to compare these. I didn’t see a way in Voyant to group them under a user-defined concept and count from there.

This is already getting very long, so I won’t show the side by side comparisons that “remember” led me to.  It is clear, however, that some of the most interesting differences between the translations come at the sentence construction layer.  Crucial sentences have significantly different syntactic constructions. I could get a sense of what the initial wordcount statistics led me to surmise, the economy of Enright’s translation over Moncrieff’s, and was struck by what I would consider “improvements” both stylistically and semantically, by going to the texts themselves to confirm.

Conclusions:

First off, disclaimer: I need to read the stats books Patrick sent out to be better able to analyze the data I did get and assess its significance. To do a study of translations, I should be more well versed in Translation Theory and literary translation theory in particular.  

Second, I’m not sure comparing translations of a single work is a good application for distant reading; as Underwood suggests, the human brain is better at comparing smaller data sets.  And there aren’t many data sets including translations of larger works that would generate enough volume to make sense. On the other hand, taking a larger view of the trends in translation over a longer span of time, with multiple texts, could be very interesting.  Further, I wonder what I could have unearthed, at a more distant view, if I had been able to drill down to syntactic analysis, sentence construction, etc.

The focus of this assignment was to get started with this sort of tool, to play around with it.  As a result of my “play” and the constraints of what I chose to play with, I found myself jumping back and forth between distant reading and close reading, finding more in the latter that seemed meaningful to me.  But I was struck by what some basic stats could tell me — giving me some areas to further investigate in close reading — such as the implications of the disparity in number of sentences and word count.

Now to Voyant.  Once I had “cleaned” my texts, it was incredibly simple to get up and running in Voyant.  In order to compare different texts in the same upload, it took some digging, however. I would suggest uploading files, because then Voyant knows you have separate corpora.  The information is there, mostly, but sometimes hidden; for example the Summary tool compares word count, vocabulary density and average sentence lengths, but then combines the corpora to determine the most frequently used words.  It was only in the Document Terms tool that I could see the word counts separated by corpus — and this only on words I selected myself, either by clicking on them somewhere else or entering them in the search field. I would like to see a spread of most commonly used words by corpus.

The Terms tool is fantastic for drilling down to a terms collocations and correlations.  Again, I wish that it had separated the stats by corpus, or given us a way to do that without invoking other tools.  The Topics tool confused me. I’m not sure what it was doing ultimately; I could tell it was clustering words, but I couldn’t tell the principle.  I will need to look at this more.

So, Voyant was very easy to get up and going, had a short learning curve to explore the significance of the tools provided and can really get at some excellent data on the macro level.  It becomes harder to use it to customize data views to see exactly what you want to see on a more micro level. I don’t fault Voyant for that. It’s scope is different. As a learning tool for me, I am very grateful to have given it a shot.  I might use it in the future in conjunction with, say nltk, to streamline my textual investigations.

Workshop: Python

Last Tuesday, I, and a few others from our class, attended the Python Workshop offered by the GCDI fellows.  

Clearly, the purpose of the workshop was to introduce people with little programming background to some basic principles of programming and to a few foundations for the syntax of Python.  First off, I think it is next to impossible for a 2 hour programming workshop to do more than help participants clear initial hurdles (or inertia) necessary to start the long, hopefully exciting and empowering, journey into learning how to program.  Secondly, the specific hurdles you need to clear really depend on where you are in the learning process. Many of the participants, for example, had never programmed before, but some in that group came in with a clearer idea of what coding is than others — having absorbed mental models of the abstract spaces in which it works.  So, it’s not an easy workshop to design.

That said, I think Rachel (the lead instructor) and Pablo (the support instructor) did a really good job of getting us going with the language.  What I would have liked to have seen was a little bit more on where we should go next to make Python a useful tool for us, and to give some of us an idea of the kind of investment needed to do so.  Rachel did mention something that seems hugely important to approaching learning Python: instead of trying to learn the language in some sort of systematic and holistic way from the outset, start with a problem you are trying to solve, a thing you want to do, and learn how to do that thing.  You’ll have stakes, then, that will motivate you to push on when you run into inevitable impediments. You’ll also pick up a lot of the surrounding programming, API and implementation principles in a more grounded and transportable way.

Okay, so what did we cover?

1.

Initially, why program in the first place?

  • Learning programming helps you understand computing better in general
  • It thus makes you a smarter computer user
  • Importantly, it develops problem solving skills, systems thinking skills, and gives you experience in reducing complex problems into simpler components
  • And, hey, if you get good at it, it’s extremely marketable

2.

Why use Python in particular?

  • It’s not the hardest language to start with
    • It’s interpreted rather than compiled, so you can very quickly and easily see the results of what you are coding
  • Lots of online resources for learning (famous for its great documentation)
  • Many open-source libraries for Python, which means lots of tools you can use to build programs
  • Quickly becoming industry standard for certain fields (particularly machine learning and text analysis)*

3.

As far as the language goes, we covered:

  • Data types (e.g. integers, floats, strings)
  • Assignation of data values to variables
  • How Python stores and manipulates those variable values in memory
  • Defining and calling functions
  • The “list” data structure (called “array” in other languages)
  • And the use of “Definite Loops” (loops that iterate through a list a fixed number of times)

We didn’t get to what Rachel called “Decision Structures” due to time — (decision structures manifesting as if/else if/else constructions that evaluate inputs and run different code based on the value of said inputs).  

All of this stuff, including the decision structures lesson, you can see up on Rachel’s GitHub page for the Workshop here: https://github.com/rachelrakov/df_code/blob/master/Intro_to_Python_Programming_py3.6.ipynb

One of my favorite parts of the workshop, however, was being introduced to Jupyter Notebook (http://jupyter.org/) which Rachel used as the presentation mechanism.  You can see its output on the GitHub page. It seems like an amazing tool for teaching (particularly code), because you can include instructional text alongside code blocks that actually run in the notebook.  Pablo mentioned that Jupyter Notebook also works with an assortment of visualization packages. So, while I went in to get some Python information, I came out with a new pedagogical tool to explore!

Final thoughts:

As has been mentioned, I’ve done a lot of programming in the past, just not with Python.  If this is true of you as well, I would not recommend the workshop — you are not the intended audience.  However, if you want to get started programming in general, and/or with Python in particular, I think it’s great.  Not only will you get the initial nudge everyone needs, but you’ll meet some great Digital Fellows who can be resources for you in the future.  I recommend you ask them where to go next to start using Python productively in your work.

Edit: one final thing, don’t forget that Patrick Smyth, our fearless advisor, is highly proficient and experienced in using Python; he is a tremendous resource both for getting started and hacking on the code you’re working on.

*I pulled this section almost directly from the GitHub page