I had a sneaky feeling that my dataset wasn’t going to work for network analysis, but I had found such a good dataset that I decided to try. This is an Excel spreadsheet compiled by the New York State Department of Corrections listing 602,665 people incarcerated in New York State over the last ten years, with information about admission type, county, gender, age, race/ethnicity, crime and facility. I knew six hundred thousand records were too many, but I figured I’d select just a few, and analyze the networks I would find in these.
The “few” records I selected were those of 771 men and women sentenced in 2018 to shock incarceration, a military-style boot camp initiative that was supposed to reform incarcerated people by subjecting them to strenuous physical and mental trials. According to the U.S. Department of Justice, shock incarceration involves “strict, military-style discipline, unquestioning obedience to orders, and highly structured days filled with drill and hard work.” The data I looked at shows that most people in these facilities were incarcerated for drug-related offenses such as criminal sale of a controlled substance (CSCS) or criminal possession of a controlled substance (CPCS). When marihuana is legalized the population in these facilities – and others – should, I hope, drastically decrease.
I fed the 771 records into Cytoscape and it was a total mess. I tried analyzing only the 106 women sentenced to shock incarceration in 2018 and that was still a mess. The main problem, I realized, was that I could see no clear relationships between the men and women listed in my data other than the relationship they have with the facility in which they are confined. I don’t know who hangs out with whom. I don’t know if people sentenced for different crimes are placed on different floors. It would be too much work to find out who transports the food to the facility and how many guards there are and so on. Frustrated with my project, I saw that trying to get data to bend to software is a lousy way to go about things. I started to think instead about what software would help me explore the data in a meaningful way and decided to see what I could do with Tableau. This was such a good choice that I’m having a hard time stopping myself from building more and more visualizations with what became a wealth of information when I stopped looking for networks that weren’t there.
I couldn’t embed Tableau Public in WordPress so I paste pictures here, but you can’t click and scroll and interact with my visualizations here, and some of the pictures are cut off so please visit my visualization on Tableau. By the way, I was happy to remember that students can get Tableau Desktop for free for a year. Here’s the link: https://www.tableau.com/academic/students
First, here is the mess I made with Cytoscape (I didn’t even try to figure out how to embed):
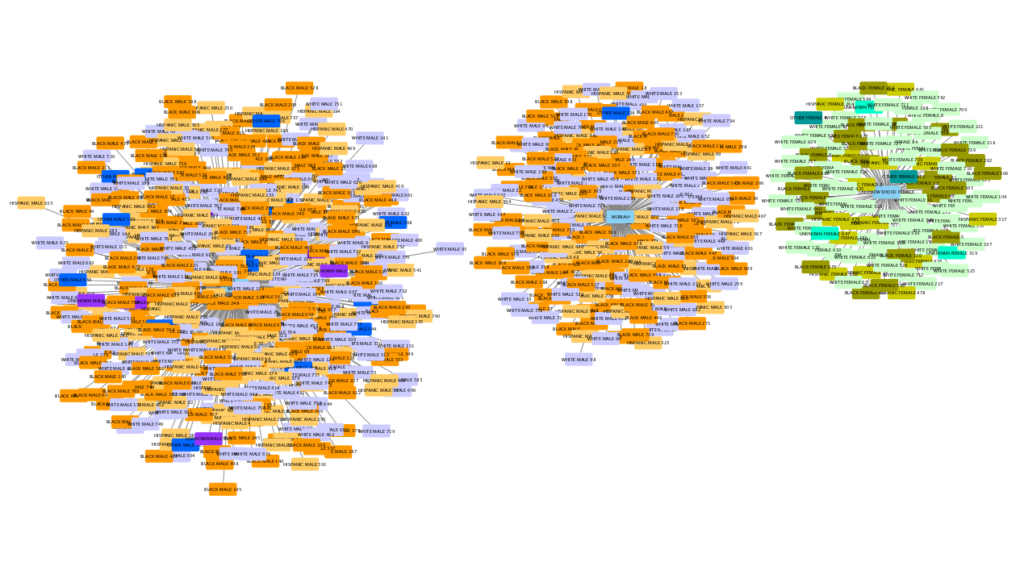
Isn’t that horrible?! Here’s a close-up:

And here are pictures of what I did with Tableau:
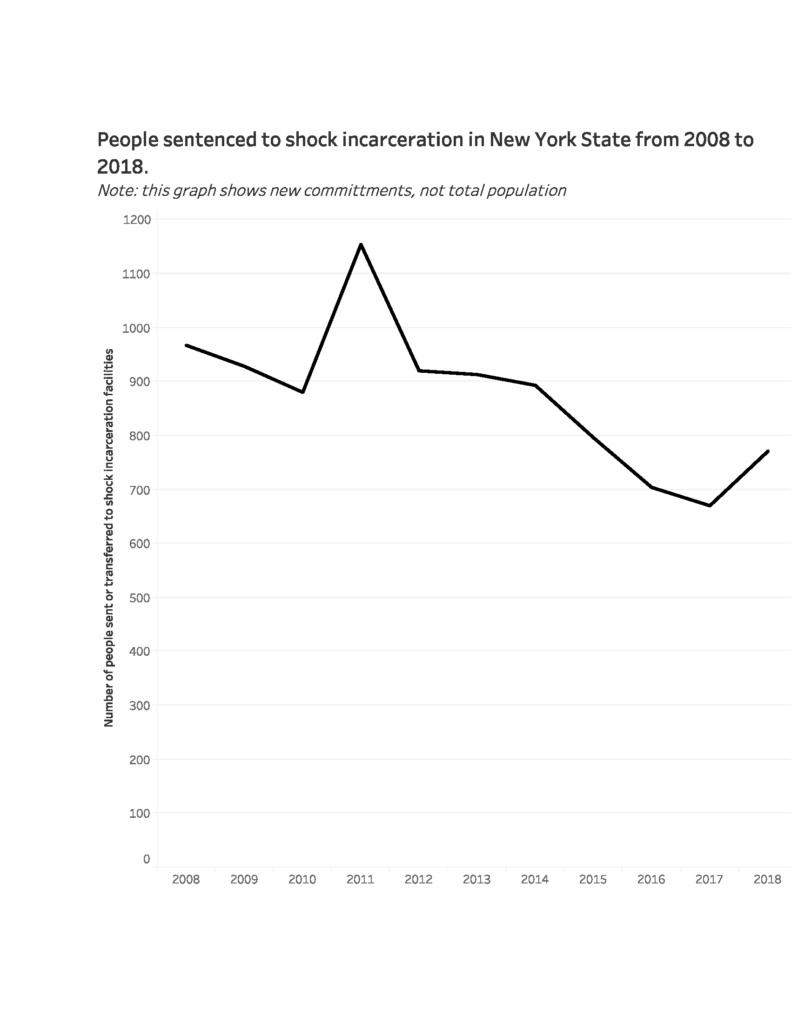

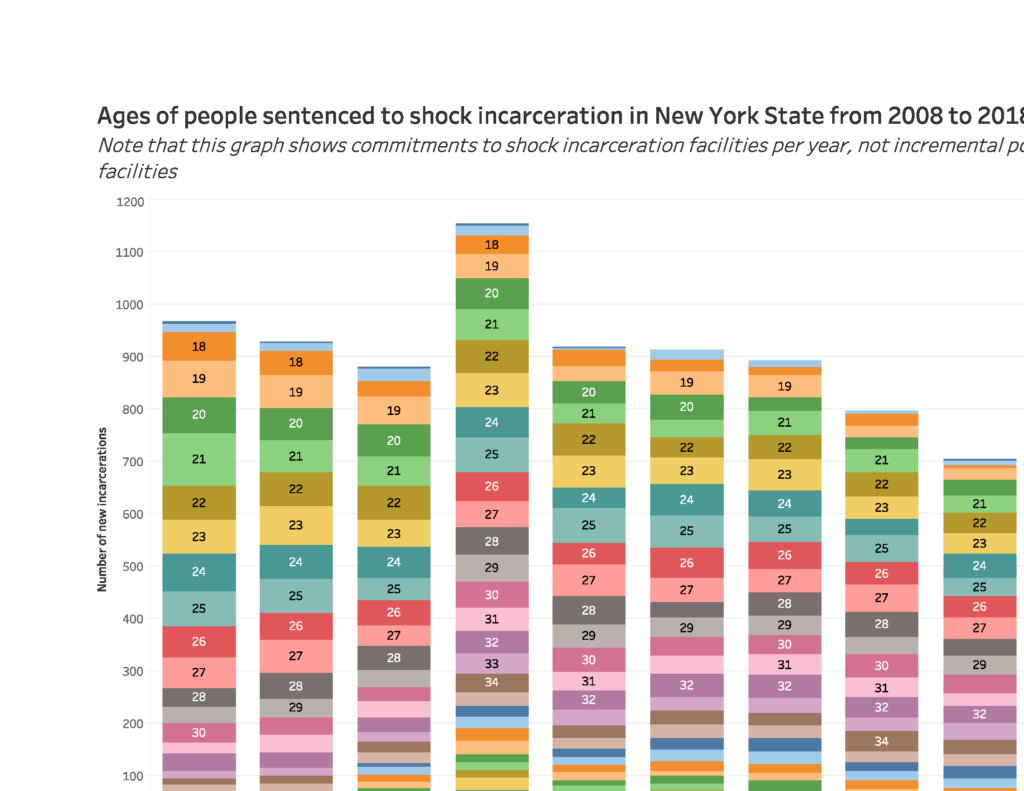
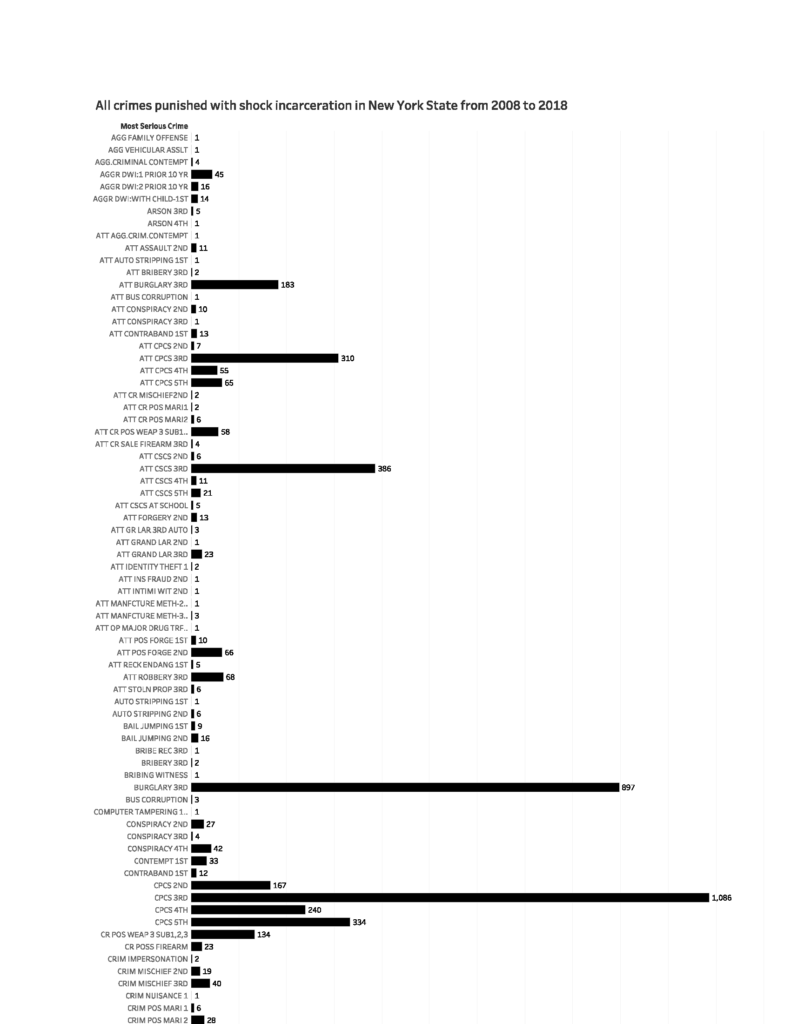
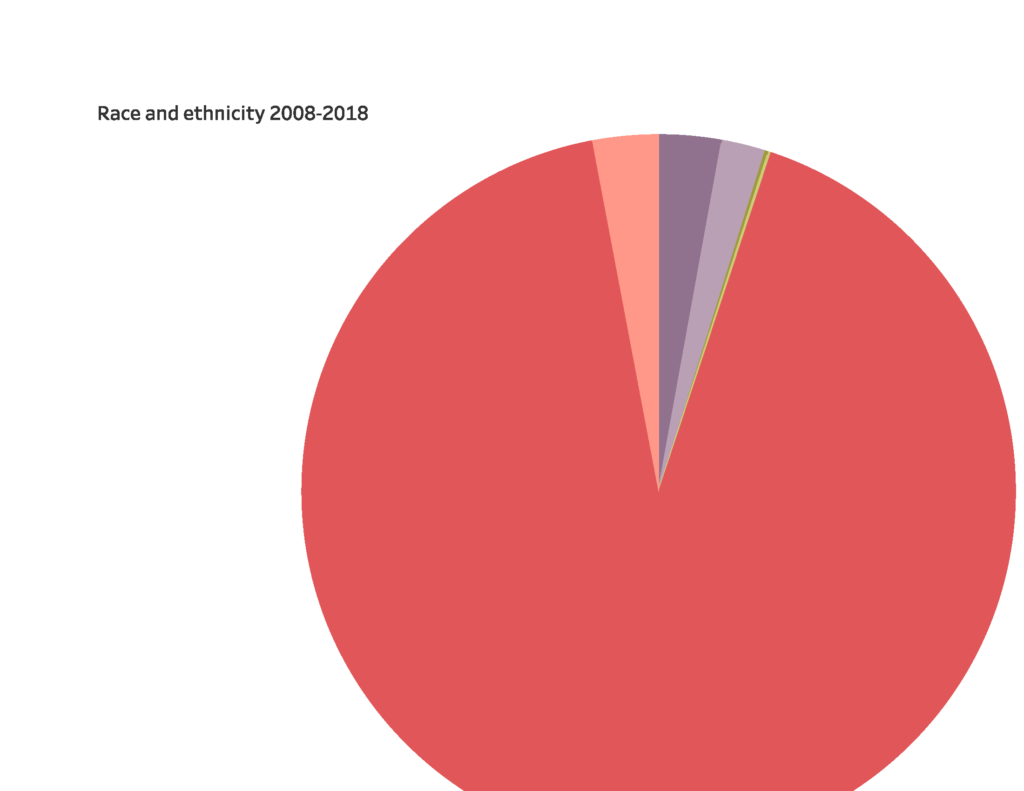
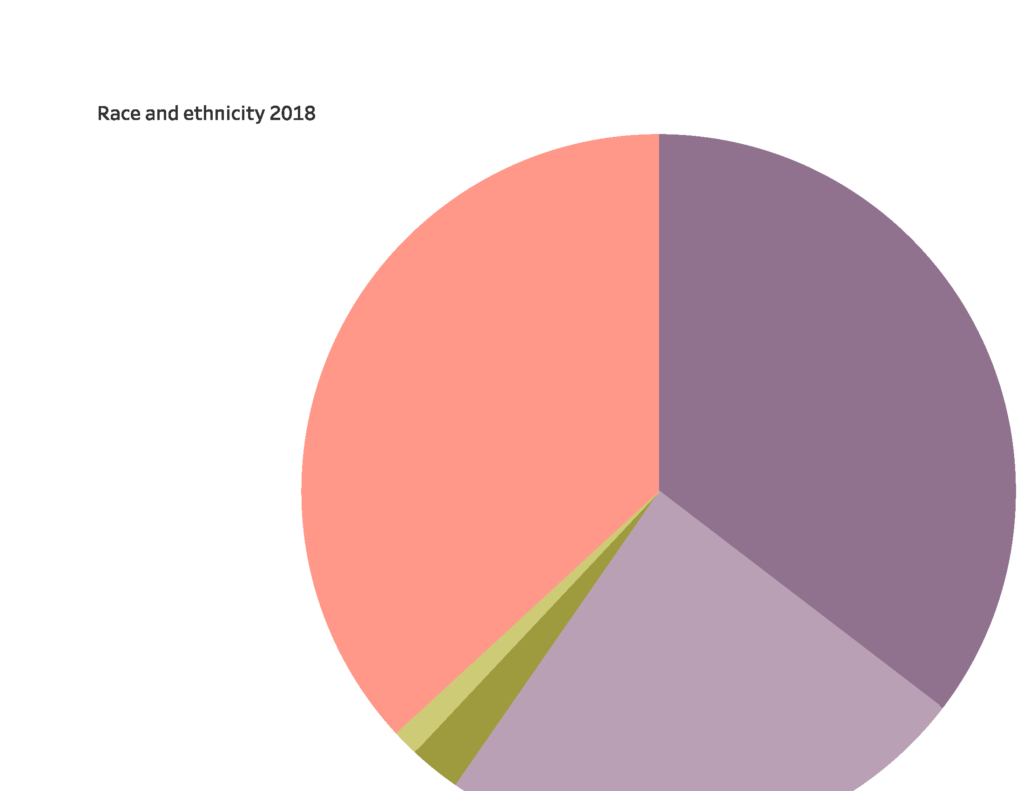 Phew, that’s all for now. See it on Tableau, there’s no comparison.


Sabrina, great point that not all types of data are suitable for all types of analysis!
This is an interesting dataset and project. (Isn’t is horrible we’ve had 600,000+ incarcerations in NYS alone over the past ten years?!) Your visualizations have piqued my interest and open up many more questions to explore. For instance the pie charts, if I’m interpreting them correctly, indicate that race and ethnicity started being tracked in 2018. I wonder what exactly spurred that change.
Tableau note: Unless I’m mistaken, the student license can be extended every year. The license only lasts for a year at a time, but one can reup.
Hey Hannah, I’m glad my visualizations got you interested in this data set! There’s a ton of stuff to do with it. Yeah, you interpreted the pie charts correctly. I’m glad you didn’t need explanatory notes, which I wrote but then chose not to add as annotations in the Tablaeau dashboard because the annotations looked clunky to me. I remembered Michelle and Erin saying last summer that in visualizations often less is more and I agree that too much text can rest power from the viz.
Yes, it’s horrible that there have been 600,000+ incarcerations in NY State alone over the past ten years. And these are just new incarcerations. According to the Department of Justice census and if I’m reading their report right, 24,461 people were incarcerated in NY State in 2017.
http://www.criminaljustice.ny.gov/crimnet/ojsa/jail_pop_y.pdf
For your interest, here’s a handy key to crime charges code (I forgot to add it to my blog or viz):
https://www.backgroundchecks.com/learningcenter/terminology