Author Archives: Anthony Wheeler

Final Project: Gaming & Representation within Digital Humanities (Anthony & Raven)

For the final project, Raven and I have created a playable beta of a game that attempts to address the intersections of online spaces, education, representation, and equity/accessibility through digital tools in learning spaces. Raven and I divided this post into two in order to explain our different angles on the same goal.

Our overall goal of this project is to find a way to increase the parameters of equity in a standard classroom, as well as offering alternative methods of knowledge creation. We want to use interactive technology as a method to give voice to those often misinterpreted or silenced within the traditional western literary canon. In education, we need to utilize multicultural texts as a means to provide diverse student-bodies with the ability to align themselves with the literature at hand. However, there is the battle of always having a group of students who will not align with what the class is studying. So, we believe that by utilizing gaming in the classroom you can expose students to different experiences such as diversity in race, disability, gender, and sexuality.

In constructing this game from a digital pedagogical perspective, I drew information from scholarship surrounding these topics, specifically in terms of educational facilities. Right now, I am using information from Tools of Exclusion: Race, Disability, and (Re)segregated Education by Beth A. Ferri of Syracuse University and David J. Connor of Columbia’s Teachers College, as well as Cathy Davidson’s (a professor here at The Graduate Center) How and Why to Structure a Classroom for Student-Centered Learning and Equality from the collection Structuring Equality: A Handbook for Student-Centered Learning and Teaching Practices, published by HASTAC. The first piece addresses the complicated issues around the interconnectedness of segregation, special education, and race. The second piece dives into how we can restructure English courses (and the classroom in general) to create a more equitable space in terms of helping students foster their identities. Helping students develop a deeper understanding of not only their own identity experience, but as well as their peers’ difference identities, helps to foster a safer and more productive classroom space.

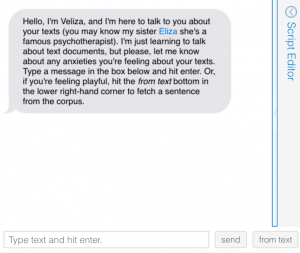
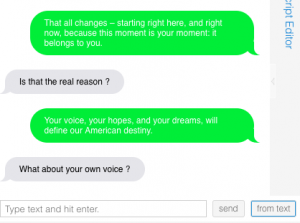
Another piece I am drawing upon to support these notions in a more direct way is No Fun: The Queer Potential of Video Games that Annoy, Anger, Disappoint, Sadden, and Hurt by Bonnie “Bo” Ruberg. Ruberg shines a light on the aspect of “Play,” taking it in a direction of how the idea of “having fun” is so closely related to gaming. We buy and play games because we enjoy them and have fun, but not everyone has the same type of fun with certain things. She continues to talk about how “no-fun” can be a tool for addressing uncomfortable topics that need to be talked about. We have developed a game based around this notion because topics of prejudice are uncomfortable topics in whichever form they take. So we are using a game as a platform to widen the perspective of students using emotional experiences linked to the said game.

In relation to Digital Humanities, we believe that platforms like Twine are very user-friendly, and definitely open up the opportunity to scaffold the assignments (like Ryan Cordell suggests doing in How Not to Teach Digital Humanities) so that students can naturally be exposed to digital humanities in all of its glory. Creating these narrative-based games offers up an entirely new way to write and create public knowledge, two very important aspects of academia. This could lead to potential workshops on using different game-creation platforms and how to implement them pedagogically.

Biometric Stereotyping: A Tool of Oppression

Upon reading both of the Zach Blas articles, along with viewing the video “Facial Weaponization Communiqué: Fag Face (2012),” I can honestly say I am quite horrified at the discoveries made by these researchers. I have never really thought about the concept of biometrics and facial recognition, and even when I did think about these topics it was in the realm of specific facial recognition (such as with the most recent iPhone series), and not as a tool of categorization and oppression. Although it is true that you may find differences in human body types based on genetics, that does not mean these technologies should be made to ignore features of diverse bodies.

Blas addresses specific failures in terms of biometric technology’s inability to include diverse features when he explains: “Asian women’s hands fail to be legible to fingerprint devices; eyes with cataracts hinder iris scans; dark skin continues to be undetectable; and non-normative formations of age, gender, and race frequently fail successful detection” (Blas). When I was getting ready to start working within schools during my undergraduate degree, it was required that I get fingerprinted so that this personal biometric information was in the system. I didn’t connect that idea that the size of the scanner used would not have been practical for someone with smaller hands than I. These devices are used every single day, around the whole world, yet they are not built to accommodate the realistic world, the people we see walking past us on the streets of our neighborhoods.

Iris scanners falling short when it comes to cataracts very directly oppresses Black and Hispanic individuals for they make up a majority of those who develop cataracts at some point in their lives. Lastly, we (hopefully) do not even need to discuss how facial recognition failing to identify dark skin falls under the category of oppressive. Blas also discusses how there are claims that these facial scanners can determine characteristics of the person below the surface of their skin, such as gender and sexuality. I would like to point out how wrongful and dehumanizing it is to categorize physical human features into such general groups. As someone who is a biracial person of color, I carry features of both my Dominican father and my English & Irish mother. So put me in front of a facial recognition scanner, what exactly will come up? Or will it just get confused? Encoding the device in this manner feels almost colonial. It reads faces and other bodily features and provides information that attempts to keep human beings separated as if members of different species.

I used the term “colonial” because of the way this mode of thinking resonates with segregation and slavery.  Blas also wrote about how once the facial biometric diagrams were fabricated, the metal replicated what appeared to be facial cages similar to that of handcuffs, prison bars, and torture devices used during Medival times and slavery in the United States (Blas). The images of the face cages are incredibly discomforting but definitely powerful. This is where Blas begins to intersect with a point made  by Simone Browne in her essay “Race and Surveillance.” Dating all the way back to slavery and the Transatlantic Slave Trade in the USA, slaves would be cataloged as a form of “disciplinary power” (Browne 73). Browne continues to explain how this disciplinary power is exercised through its invisibility, whilst simultaneously imposing a compulsory visibility on its targets. This concept links to the idea of these oppressive systems being invisible to those of us who are unaffected by their tyranny. All while these same oppressive systems that are in place exist as daily and active thoughts in the lives of those who are affected. I think it’s important to not be ambivalent about these oppressive technologies solely because it does not concern you directly. If it affects a people of any demographic in a negative manner,  it should become a priority to fight for a positive change with the goal of reaching true equality.

A Successful Story Mapping Workshop

This past week, I attended a workshop titled “Create A Rich Multimedia Narrative with ESRI Story Map.” The workshop was hosted by two of the GC Digital Initiatives’ digital fellows, primarily being conducted by Olivia Ildefonso, with assistance from Javier Otero Peña. The goal of the workshop was to teach us how to effectively use ArcGIS‘s “Story Maps” feature. I was a bit hesitant to work with ArcGIS because I used it once before for a different class and it was a bit difficult to navigate. However, I was pleasantly surprised at how user-friendly it is and overall how naturally the skills needed to create an efficient story map came to me.

Olivia and Javier prepped a Google Slides show as a guide for the participants, but they prefaced the actual story map developing with making sure we went and downloaded a previously created folder on Google Drive. The folder contained all of the materials needed to create a replica of Olivia’s story map, “3 Weeks in Argentina.” I was actually worried about how efficient this workshop would be, thinking we may be creating random story maps. That would open up the possibility of ten different problems arising all at once. The method of having us replicate a demo story map was actually significantly helpful and definitely prevented any potential chaos from erupting.

I was planning on sharing some screenshots to show some of the work we had done, but I realized that defeats the purpose of the story map (I did, however, embed a link to Olivia’s demo in the title above). The difference between a story map and a simple PowerPoint presentation is that the story map brings a presentation to life. You can make your slides immersive, meaning that they can naturally phase between slides (and you can change the phasing effect), present media  (such as live videos playing behind your text boxes, or a stagnant video clip waiting for the viewer to press play), present data via different methods, and much more.

What I should be clear about is the fact that we used the “Cascade” style story map, which is only one of seven different style options. The cascade option fits that of more narrative-based presentations (which is why we worked with information/media from Olivia’s trip to Argentina). With my background being in Education & English, I immediately thought of this as a great tool for narrative-based projects in English classes. Even something as simple as book reports could be an assignment that opens up students to the world of digital humanities. Similar to what Ryan Cordell wrote in his essay “How Not to Teach Digital Humanities” within the Debates in the Digital Humanities 2016 edition (a recent reading of ours), we need to start small with our students and help them climb the scaffolding we lay out in order to help them reach the top. Even simple mapping tools such as ArcGIS’s story mapping is a gateway tool to bigger DH projects, which is something we need to take into consideration when developing curriculum. I’m currently thinking of projects I have done as well as projects I have given students in the past and am thinking of how I could incorporate something like story mapping.

Overall, this workshop went incredibly smoothly and is probably tied for first for my favorite workshop thus far (the other contender is my HTML & CSS workshop with Patrick Smyth). Story maps is a great tool for making presentations much more fun and engaging for students/your audience. It is an incredibly flexible digital tool and surely one that I will be utilizing in the near future. I highly encourage those of you who couldn’t attend the workshop to go to the website (link embedded in “Story Maps” above) and play around with it! Hopefully, you will find it just as easy to use as I did!

Hate Crimes by County and Bias Type: Network Analysis Praxis

So for my praxis assignment (after spending an extensive evening trying to understand and figure out Gephi) I decided to go with Palladio, the engine developed by Stanford University. After playing with the provided sample dataset provided n Palladio, I encountered the frustrating issue of finding a dataset that I wanted to work with and worked in Palladio. The initial set I wanted to use was not available in the form of a comma separated value file (.csv), so I had to keep looking. This is when I found www.data.gov,  which provided over 18,000 datasets from our area alone. Now that I was in a dataset wonderland, I had found more than several interesting data topics I wanted to work with from disability to car accident statistics. However, this is when I ran into the final pothole in the road to success with this praxis assignment. The sheer size of the dataset played heavily in my ability to use. Plugging in a dataset with well over 4,000 brackets of data tended to cause Palladio to crash entirely. Given Palladio is an open-source digital tool, I’m sure its power to remold datasets only goes so far. Finally, I found a dataset that came in the proper format and was a reasonable size to plug into Palladio.

I decided to work with a dataset titled Hate Crimes by County and Bias Type: Beginning 2010, based on New York State counties. Being someone who fits into several different marginalized communities, this was something I was especially interested in. I was born and raised about a couple hours north of the city in Ulster & Dutchess counties. However, growing up I also spent a lot of my time with family down here in the city, so knowing about these two different cultures and lifestyles I was curious to know the difference in terms of violence against these people labeled as “other.”

I mainly utilized the graphing feature on Palladio. This feature divides the source subject into nodes, and then they connect them to the target nodes in order to represent connections in the dataset. Before diving into specific the counties, I started by showing the correlation between hate crimes against properties versus hate crimes against individual people/groups of people:

Crimes Against People Vs. Property Crimes

This was where I first learned something thanks to the visualization of the data. Notice how the connection between the nodes create a bowtie-like image, it shows that there is a great amount of overlap between these property crimes and crimes against people themselves. This is not something I imagine many people would take the time to scour through the dataset and mark down these similarities, so having this software where you can plug the data in and have it spit out a visualization like this is incredibly useful.

So another common issue I decided to look into before tackling individual counties was crimes against religious practice. We live in a post-9/11 society, and as a result, there is an unfortunately extreme level of prejudice against those within Muslim communities. So first I went ahead and searched the total incidents of hate crimes against religious practice as a whole, followed by specifying hate incidents towards Muslim practice:

Total Incidents of Anti-Religious Crimes

Total Incidents of Anti-Muslim Crimes

In comparing the numbers as well as the intensity of the nodes, we can see that there are many general hate crimes against religious practice as a whole, but if you look at the following graph that focuses primarily on anti-Muslim hate crimes you will see that a truly astounding percent of the religious hate crimes are against Muslim religious practice. This obviously reflects off of what I previously mentioned about the existing prejudice, and it validates that statement.

Alright, now for the New York State counties. For starters, I decided to look into the total number of hate crime offenders versus the number of hate crime victims:

Total Number of Offenders by County

Total Number of Victims by County

Interestingly enough, you can see by the large cluster of engorged nodes in the offenders graph that there are a significantly higher number of offenders than victims. This is because a hate crime does not always mean physically damaging a person or group. So we can see that this significant gap between offenders and victims signifies that hate crime offenders are practicing in much more subtle ways such as only serving/hiring people within a specific demographic, intentionally excluding others.

One issue I did run into while going through this process, was a strange inconsistency in the statistical graphs for anti-gay hate crimes that took place. Below I provided the total number of incidents involving hate crimes against the gay community, and the counties where these hate crimes took place:

Total Number of Anti-Gay Hate Crimes

Counties Where Anti-Gay Hate Crimes Took Place

According to the first graph, there were a staggering number of incidents in terms of anti-gay hate crimes between 2010 and early 2018. However, in looking at the specific counties, it is showing it only took place in a few different NYS counties. There could be a misconnection with the data somewhere, but I am incredibly novice at this so I am not sure where. That or a disturbing amount of hate crimes took place in only several counties.

The last example I’ll provide shows anti-black hate crimes across New York, and I think it gives up some perspective on historical events:

The Number of Anti-Black Hate Crimes

Thanks to this visual, we can see that a lot of the anti-black hate crimes take place on the southern end of New York State. Historically, there are tensions between inner-city communities and those of suburban communities such as Westchester County and Yonkers. Upon ideas such as public housing entering these suburban communities, their development was met with a lot of backlash provided by Italian and Irish citizens. This was primarily an issue when the country was still slowly desegregating, but these issues still run rampant today (as you can see by the visualization) and can be seen between New York City burrows and suburbia.

In the end, I thought this was a pretty neat little experiment to get a feel for these visualization tools. One day I will conquer Gephi, but today I am satisfied with my accomplishments regarding my analysis of this dataset using Palladio.

How to Teach Digital Humanities to Undergraduate Students

I really appreciated Ryan Cordell’s contribution to the Debates in the Digital Humanities 2016 edition, “How Not to Teach Digital Humanities.” I think it’s important that we take his guide into consideration when building future courses for undergraduate students with the goal of piquing their interest in digital humanities. Hearing the phrase “digital humanities” can be an intimidating experience for young students who are still figuring their own paths out. Upon hearing about it and researching much more fleshed out DH projects online, the thought of tackling what is essentially computer science is terrifying.

For myself, I was in a class full of English and English/Education majors when I was first introduced to the digital potential of the humanities. Being a class full of English students, whose bread and butter of work is writing papers, we were obviously a little hesitant to dive into coding literature. That’s where my professor’s pedagogical methods matched that of Cordell’s recommendations. For starters, as Cordell suggests, we started small. The class was titled “Digital Lyric,” which meant that we did not work with large pieces of literature. We worked solely with poetry and musical lyrics. This made it easier to tackle the incoming assignments. We were not so focused on reading large volumes of work, but rather on the concise prose that we eventually had to rework digitally. We start light, with simply engaging with these DH tools as a way to start a conversation amongst the class. For example, we used the digital tool Prism, which my professor worked on at the University of Virginia. As the website states, Prism is a tool for “crowdsourcing interpretation.” So my professor uploaded a poem, Ozymandias by Percy Bysshe Shelley, and we had to highlight the poem according to certain themes (each associated with a different color). In the next class, she was able to take all of our highlights and layer them over one another. It provided us with percents for each theme, and the class unfolded from there.

This was a very small start in terms of the massive tent that is DH, but it was easy and exciting. We were more prepared to slowly step into the world of digital humanities now that we understood some of what it could do for us as humanities scholars and educators. Next, Cordell suggests you integrate when possible. We went on to talk about poetic form, which brought us to the concept of deformance. After reading a brief piece on deformance (with the intention of keeping the reading light, my professor wrote up her own note sheet on it for us), we actually used a tool to create a bot that randomly provided a new apology in the form of the poem “This Is Just To Say” by William Carlos Williams. We, a class full of English students, learned some basic coding and did well! Other English staff thought my professor was wild for trying to teach us code, but it was incredibly successful. Click here if you want to see the bot and generate some funny parody poems! There is also a Twitter bot that occasionally does the same exact thing, also worth a gander! So in studying poetic form, we also learned how to play with it using technology.

Cordell’s third rule expresses how critical scaffolding is. To put it plainly, you must build up one skill on top of another in order to tackle larger projects. This is the point where we started working on our Victorian Queer Archive with students at Dickinson College. We were each assigned a queer author from the Victorian era, then we had to take one of their poems and do some research. We had to get the details on their publication, find original images, and more. Then we took that information and pieced them into this large archive, making this our first digital humanities project that we all worked on. At this point, we had a solid foundation of DH knowledge and being that there were a large number of us, it was not intimidating to participate in this project.

Cordell’s fourth and final suggestion is to think locally. He doesn’t quite mean “support your local businesses” (although we should also be doing that), but more so that we should be more focused on digital humanities projects/work that is in the interest of the students and their university rather than impressing people who aren’t of significance to the students. Think more about how this work can promote their own work in the DH direction, and how that could meet the goals of the college in question. In our particular instance, we used the digital humanities as a tool for echoing the importance of diversity and equity. This was something that was very important to our campus and student organizations, so it was very encouraging to discuss issues of race and queerness through digital literary projects.

All in all, I really liked Ryan Cordell’s points because to me, they’re just solid suggestions. These points were followed by my professor in undergrad, and now I am studying DH with you all here at The Graduate Center. This course paved a path for me, a truly lost humanities student, that I did not know existed. I’m sure there are many of us who have told our friends and family that we are studying digital humanities, only to be met with a “Nice! What is that?” Given that it is still considered an emerging field, that is okay, but we need to seize the opportunity to expose more undergraduates to this potential since I agree that it is the future of humanities departments. We need to spread this fire.

Text Mining Using Voyant Tools – A Comparison of Barack Obama & Donald Trump’s Respective Inauguration Speeches

So a couple of years ago I was introduced to Voyant Tools, and it was then that I splashed around in it in order to simply get a feel for text mining. Today, however, I dove right into it. I figured a fun way to really get a diversified experience out of the software would be to text mine two separate things and compare them. So then raises the question, what would be a solid set of texts to compare? You guessed it, I went ahead and plugged in former President Barack Obama’s and current “President” Donald Trump’s inauguration speeches to see the difference between their directions as newly elected presidents. The results I came across were very interesting, yet not entirely surprising all at the same time.

To preface the impending conversation, we all know how Donald Trump’s campaigning for the 2016 election went versus Barack Obama’s campaigning for the 2008 election. So the speeches they gave at their respective inauguration ceremonies really echoed what they were preaching throughout their campaigns. To start off with some simple numbers, Trump’s speech ended up being a total of roughly 1,434 words, containing 542 unique word forms. Unique words forms are basically different words. So words such as “the” are only counted once. Meanwhile, Obama’s speech reached a staggering 2,439 words, 910 unique words forms! That is almost double the length of Trump’s speech. Even their average words per second were quite different from Obama’s average being 21.6 and Trump’s only being 16.5. This could lead to a lot of sociological theories on why these speeches needed to be so different, but we’ll get to that later.

These word counts were just the tip of the iceberg. Next, we’re going to look at the Cirrus feature in order to receive a visual of what words were emphasized more in each of their speeches (visual provided below). Right off the bat, we notice that Obama (left) had a much wider range of vocabulary, which clearly shows why his unique word count was so high. From this image, you can understand how Obama was really emphasizing the idea of a new America in his speech. He used phrases such as “new,” “common,” “world,” “generation,” “peace,” and “spirit.” As for Trump (right), he kept his speech rather simple and drove the very nationalistic nail in the ground. Notice he used phrases such as “America,” “American,” “country,” “wealth,” “power,” “allegiance,” “fight,” “action,” and “destiny.”

Obama went about his campaign by attempting to give volume to the voices who weren’t heard, and we can see that in his diverse choice of words and the direction his speech was going in. Meanwhile, Trump preached much hatred toward foreigners. He boasted about the nationalism of American citizens and how he would get them jobs. He claimed he’d grant them some power through himself as a vessel, and these points all come through in his points during his speech.

Next up, I decided to dig (or should I say “mine”) a little deeper into the context of these repeated words. This led me to the very convenient Knots tool. This tool took those repeated words and phrases and provided their context. So I got to see where and how these words were used and where they overlapped. For the sake of comparison, I looked specifically at their use of the word “America.” When it came to Obama’s speech (left), he always used the term America when discussing creating a newer, more ambitious, and more equal era for the United States. It was very closely associated with his other commonly used phrase, “new.” Trump, however, repeatedly used the term America when referring to reclaiming American power and greatness. More specifically how American’s will come first before immigrants, and how it will prosper because of it.

The last discovery I’ll share with you guys is quite a hilarious one. So Voyant Tools features a messaging software called Veliza, it’s where you can chat with a bot regarding your uploaded text. You can also click a from text button that pulls a sentence from your uploaded text and responds to it accordingly. Veliza is a sister program to the much wider known Eliza, which was an AI software developed by the MIT Artificial Intelligence Laboratory back in the 1960’s. It basically would simulate a conversation using basic text patterns in order to create the illusion that it is communicating with you. However, the conversations are obviously very shallow since the software isn’t a sentient being. So, I went ahead and played with Veliza using lines from the speeches and well, it was really funny! Why? Well because the sentences pulled from Trump’s speech (right) were simplistic enough that Veliza was able to simulate a realistic conversation from what she was given! Meanwhile, Obama’s speech (middle) was too complex for Veliza to formulate a realistic response.

Overall, I had a very intriguing and pleasant experience text mining with Voyant Tools! It was incredibly user-friendly and I would recommend it to any aspiring digital humanists out there! Also, text mining as a whole is super fun so I would also suggest taking random works you like and plugging them in. There are loads of discoveries to be made out there. Physical texts are just what’s on the surface, using tools like this really resonates with the heart of DH. You just have to dive in!