Tag Archives: workshop

A Successful Story Mapping Workshop

This past week, I attended a workshop titled “Create A Rich Multimedia Narrative with ESRI Story Map.” The workshop was hosted by two of the GC Digital Initiatives’ digital fellows, primarily being conducted by Olivia Ildefonso, with assistance from Javier Otero Peña. The goal of the workshop was to teach us how to effectively use ArcGIS‘s “Story Maps” feature. I was a bit hesitant to work with ArcGIS because I used it once before for a different class and it was a bit difficult to navigate. However, I was pleasantly surprised at how user-friendly it is and overall how naturally the skills needed to create an efficient story map came to me.

Olivia and Javier prepped a Google Slides show as a guide for the participants, but they prefaced the actual story map developing with making sure we went and downloaded a previously created folder on Google Drive. The folder contained all of the materials needed to create a replica of Olivia’s story map, “3 Weeks in Argentina.” I was actually worried about how efficient this workshop would be, thinking we may be creating random story maps. That would open up the possibility of ten different problems arising all at once. The method of having us replicate a demo story map was actually significantly helpful and definitely prevented any potential chaos from erupting.

I was planning on sharing some screenshots to show some of the work we had done, but I realized that defeats the purpose of the story map (I did, however, embed a link to Olivia’s demo in the title above). The difference between a story map and a simple PowerPoint presentation is that the story map brings a presentation to life. You can make your slides immersive, meaning that they can naturally phase between slides (and you can change the phasing effect), present media  (such as live videos playing behind your text boxes, or a stagnant video clip waiting for the viewer to press play), present data via different methods, and much more.

What I should be clear about is the fact that we used the “Cascade” style story map, which is only one of seven different style options. The cascade option fits that of more narrative-based presentations (which is why we worked with information/media from Olivia’s trip to Argentina). With my background being in Education & English, I immediately thought of this as a great tool for narrative-based projects in English classes. Even something as simple as book reports could be an assignment that opens up students to the world of digital humanities. Similar to what Ryan Cordell wrote in his essay “How Not to Teach Digital Humanities” within the Debates in the Digital Humanities 2016 edition (a recent reading of ours), we need to start small with our students and help them climb the scaffolding we lay out in order to help them reach the top. Even simple mapping tools such as ArcGIS’s story mapping is a gateway tool to bigger DH projects, which is something we need to take into consideration when developing curriculum. I’m currently thinking of projects I have done as well as projects I have given students in the past and am thinking of how I could incorporate something like story mapping.

Overall, this workshop went incredibly smoothly and is probably tied for first for my favorite workshop thus far (the other contender is my HTML & CSS workshop with Patrick Smyth). Story maps is a great tool for making presentations much more fun and engaging for students/your audience. It is an incredibly flexible digital tool and surely one that I will be utilizing in the near future. I highly encourage those of you who couldn’t attend the workshop to go to the website (link embedded in “Story Maps” above) and play around with it! Hopefully, you will find it just as easy to use as I did!
Zotero Workshop – Free Citation Management Online

On October 19, I attended a Zotero workshop given by Stephen Klein of the Graduate Center library. Zotero is an online service for collecting and managing sources and citations for all your projects.

If you already know Zotero, there’s an advanced workshop on November 1.

Zotero is free and open-source, so your citations will be available even after you graduate. First register an account on zotero.org. Although Zotero is a cloud service accessible from any computer with a browser, you should download both the software and the “browser connector.”

After the browser connector is installed, a Zotero icon should appear at the top of your browser with your other browser extensions. If it’s not there, search in the extensions section of your browser menu. (On Firefox, at least. “Extensions” might have a different name on your browser.) Go into your Zotero account and create a collections folder with the name of your project. You can make as many folders as you want.

Zotero can save PDFs or any other files from websites you visit. If the online information you find is not in a PDF, Zotero will search online for an available PDF. It can also create PDFs of websites. Manual addition of offline sources is also allowed. You can search for information based on ISBN, DOI, and many other IDs. The limit on free storage is 300 MB, but you can get around this by only saving links to files on Google Docs, Dropbox, or other online workspaces.

Zotero can coordinate with Microsoft Word to create bibliographies, footnotes, or endnotes from your citations. It can automatically change the formatting to fit different styles like MLA or Chicago. You can also export your notes to Word, Excel, and other software. Notes can be written in non-Latin characters and symbols. You can share your citations with any other Zotero user.

Citations are created using metadata (notes) connected to the documents or websites. You can edit this metadata if it’s incorrect. Be sure to double-check the original metadata, because it often has mistakes or is non-existent.

If you’re using a strange computer, you can download the browser connector to add a citation to your account. Just be sure to unlink your account after you’re finished.

Data for Mapping Workshop

This workshop provided a definition and general overview of GIS (Geographic Information Systems), presented by Javier Otero Peña and Olivia Ildefonso, two of the GC’s Digital Fellows with expertise in this area.  Their presentation was very well-organized, and they both provided examples and useful tips along the way.

GIS are tools that enables one to manipulate and represent data spatially on maps.  While these tools can be complex and are very powerful, Javier and Olivia provided an introduction on the way that maps are organized (vector or raster layers).  Vector layers contain data from files which can be in many different formats.  It is these data layers that can enrich a map by providing a spatial representation of the data in visual form (as opposed to reading a table with rows and columns).

I’ve done a few assignments using a GIS tool this past summer– and while those projects were focused on how to use the tool, there was little discussion on how one gets the data (it was already provided in the exercises).  I remember struggling when searching for data to add to my map:  how did I know which database was reliable, what format to use, how to search for the correct fields?  These were the questions I had, and I did my best to muddle through it.

I appreciated that his workshop was focused on how to search for different data sets and load them into the GIS mapping program.  The whole point of using GIS is to marry the data with the map, and I suspect that this critical step is often not touched on in GIS tutorials.

For this session, the intention was to walk the group through a mapping exercise using Carto, an open-source mapping program.  There was an unanticipated change in the software, so we were unable to open accounts and log into Carto.  No matter, as we were able to focus on the main point of the session.

Given that the subject of this workshop was to locate the data and import it into the program, we were able to focus on this (and not be distracted with creating a map at this point).  I thought that both Javier and Olivia did a great job of walking us through each step, and offering tips and strategies for saving files, naming fields, etc.  We searched for the US Census data, chose a table and then narrowed down the fields that we needed and saved the file.  Then we searched for a shapefile for the census tracks; and then “joined” the information from the table with the shapefile (using a common field, in this case ‘state’).

The slides were very clear, and Javier emailed the Powerpoint slides to us afterwards – which now serve as a mini-tutorial for us to replicate on our own.

Javier and Olivia were both knew their stuff and were very effective at tailoring their presentation to the group’s level. I thought that this was just enough for an intro to the topic, and I’m definitely interested in a follow up that delves deeper into finding and evaluating sources of data.

I Attended a TLC Workshop — Notes + Visuals

I attended an informally styled, very informative workshop on Wed. Sept. 26 on “Expanding Your Pedagogical Toolkit”. The facilitator was GREAT, Asilia Franklin-Phipps, and I can’t wait to get to know her even more. The TLC Staff workshop team was GREAT also.

We were seated in groups of 4-5 at round tables in the Skylight room on the 9th floor with a  totally open view straight up to yesterday’s blue sky and moving white clouds above us (beautiful setting) and I think this contributed to the open process we were engaged in.

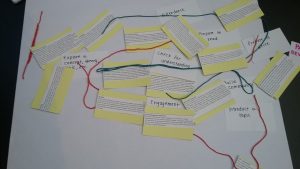
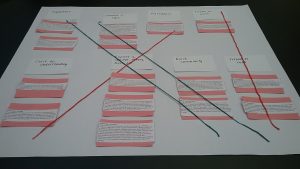
We did a hands-on project together which consisted of us reading pedagogical class ideas/suggestions “expand our teaching toolkit” aloud to hopefully inspire us. It was primarliy a matching game, though, to match the ideas with categories such as “Introduce a Topic”, “Explore a Concept, Theory or Topic”, “Engagement”, “Check for Understanding” and even “Attendance”.  We then connected/cross-referenced the categorized ideas with string.

As the saying goes, “a picture says a thousand words” so here are two photos:

1) above: photo of the table where I sat

2) above: photo of the table to my right

Wow — guess who the “linear thinkers” were…?! I think these photos not only describe the workshop but also the processes of learning how to teach, teaching and learning. Dare I use the word from our Sept. 25 class readings, “mangle” (but here with a small m) to describe the bottom photo and these collaborative processes…?

We received a wonderful worksheet handout pdf today via email from Asilia of the pedagogical ideas we read aloud and categorized, which I’m happy to share here. It’s a great document and could come in handy in case anyone hits a dry spell in their classes during the semester.

Pedagogical_Toolkits_handout

The Lexicon of Digital Humanities Workshop: 9/18/2018

I ended up attending The Lexicon of Digital Humanities workshop on Tuesday 9/18/2018 since we didn’t have class.  Also, I still need to meet my workshop requires for the course and this was a good way to do so. Particularly, I wasn’t quite sure what would be covered within this workshop, but I figured it would be especially helpful as we move forward. 

We started out with going over some general information about Digital Humanities, which I thought was helpful and particularly related to our most recent class discussions on what digital humanities is. This session defined digital humanities as “digital methods of research that engage humanities topics in their materials and/or interpret the results of digital tools from a humanities lens.” I liked this definition a lot so far. It seemed to align closely with what we’ve been talking about in class. 

Next, they had us download Zotero, which was honestly really good because I needed to do this anyway. They went through how to download it, add it to your browser and sync it to all your devices. Since I am fairly new with Zotero I was thankful for the step by step instructions. I feel like Zotoro will be such an awesome resource moving forward. 

Next, we went over many different types of data and places/ways to find it. They showed us a variety of resources which I feel will be useful in the future. At one point we split into partner groups and an individual at the table I was sitting at directed us to this resource for harvesting data from social media platforms: http://www.massmine.org/. It has documentation that explains how to do things (step by step) with minimal online command line (and apparently a lot of copy and pasting which doesn’t sound too intimidating for newcomers like myself to the field).

Overall throughout the session, there were several different tools and resources that were shared. I’ve included a link to the presentation below for more information. I highly suggest that those who were unable to attend this session take a look. A really cool project (that wasn’t included in the presentation) that we were shown can be viewed here: http://xpmethod.plaintext.in/torn-apart/volume/2/index .This project shows a data and visualization intervention looking at the culpability behind the humanitarian crisis of 2018. It’s a great example to show how digital humanities is so relevant to the world at this current moment and how its efforts can be productive in many ways. 

Here is a link to the presentation from the workshop.

After attending this workshop, one major thought that has been consuming my mind was the accessibility of the field of Digital Humanities. With many of the resources and tools being open-sourced and free, this allows those who may not have class privilege to still have equal access (keeping in mind that one still needs access to a computer and internet of course to utilize these tools/resources). This becomes an important conversation when we think about accessibility and who gets to be able to practice digital humanities. These resources and tools help provide a layer of accessibility that other fields do not always offer.

That being said, there is still a hierarchy within the field of those who have access to academia for in-class digital humanities courses and education (like ourselves), and those who do not have the privilege of being able to attend higher education courses. I do however feel that as I’ve started to become more familiar with the field, one of the main priorities has been to make as much of the content as free and accessible as possible. I hope this stays true as the field continues to develop within academia and that it does not fall into the “ivory tower” trend that has plagued some other humanities fields; (I come from a background in Women’s and Gender Studies which has been often critiqued for losing its roots in activism and accessibility by being too housed in academia).