Author Archives: Sabina Pringle

Final Project: DH in Prison

Here are excerpts from my project proposal. If you want to read the whole proposal let me know and I’ll share it with you.

Photograph from Vera Institute of Justice Reimagining Prison Report

In view of the devastating effects of mass incarceration in the United States and in an effort to address the needs of incarcerated people as they rebuild their lives, I propose to design and develop an undergraduate college-level course in digital skills and digital humanities to be taught in prison. Although education is a powerful tool for successful reentry, only 35% of prisons in the United States offer college courses at the present time.[1] Digital humanities are hardly taught at all. An environmental scan of college programs in prisons shows a low occurrence of digital humanities courses in curricula largely due to a scarcity of hard and soft infrastructure to support digital work and because incarcerated people are generally forbidden access to the internet. This gap, or digital divide, presents us with an opportunity to build a course that does not exist at the present time and to innovate through exploring ways to teach specific digital skills without an internet connection. By developing minimal computing software we will create course materials easily exportable to low-tech environments around the world. We will produce a course curriculum, syllabus, lesson plans with datasets, open source documentation and a project website.

This project comes at a time when the field of Digital Humanities is turning from seeing itself under a big tent to being under no tent. Teaching digital humanities and digital skills in prison is an opportunity to share the work we do in the field of digital humanities with a population that on one hand, given its disadvantages, will benefit greatly from having a digital edge and on the other hand will add new perspectives and contributions to the field of digital humanities, expanding its scope by bringing the interests and concerns of communities traditionally underrepresented in digital humanities to the fore.

Photograph from Vera Institute of Justice Reimagining Prison Report

Photograph by anonymous

[1]Bender, Kathleen. “Education Opportunities in Prison Are Key to Reducing Crime.” Center for American Progress, March 2, 2018.

See also Reimagining Prison Report. Vera Institute of Justice, October 10, 2018.

Workshop: ESRI Story Maps

As you may remember, I created an ArcGIS Story map for my 5-minute project presentation last week. Although I created it in a rush and it was longer than I had time for, I think story maps can be a good alternative to power point slides depending on what you’re doing and are also a fun way of keeping a journal, so I want to share what I learned in the ESRI Story Map workshop I took with Olivia Ildefonso and Javier Otero Penya.

Olivia told us that ESRI is the leading story mapper right now. They’ve really taken over the market, she said. The cool thing with ESRI is you don’t even need a map to create a story map. You just need pictures. Olivia doesn’t use it for mapping. She uses it for pictures and text.

ESRI is a for-profit company. They offer the story-mapping tool for free. Why use ESRI? Because it’s free and open-sourced. Therefore, if you’re a developer and want to customize it even more you can download it and customize it. You can get code from Github. Furthermore, It’s easy. You don’t have to know how to code or map. You can embed maps if you want but they have to be ESRI maps. You can’t use Carto.com. Now here’s the rub: if you want to create a map with ESRI you have to pay. But there’s a way around this: GCDI has a one-year ESRI interactive map for students. Go chat with GCDI if you want to access that map.

ESRI story maps are like some of the articles we see in the NY Times (this article on Yemen, for example, was built with ESRI or a very similar program).

To build a story map with ESRI, go to https://storymaps.arcgis.com and create an account. Choose the kind of story map you’re going to create. Olivia suggested starting with Cascade. Create a story board before starting creating the story map! Olivia recommends doing it in PPT. Include photos and notes. Videos have to be shared from youtube. This is the story map I built in the workshop.

In it you’ll find notes I took of some of Olivia’s and Javier’s suggestions interspersed with a lot of nonsense I wrote as I feverishly followed Olivia’s directions, and an odd assortment of photos I pulled at random from my files. I like how the little dog becomes the big dog; that was a lucky accident. You’ll figure out how to use ESRI easily if you just dive in and play around.

Shannon Mattern’s Critical and Generative Structures

In “Scaffolding, Hard and Soft – Infrastructures as Critical and Generative Structures” (2016) Shannon Mattern, Associate Professor of Media Studies at the New School, delivers a hopeful and inspiring message and provides a clear introduction to the importance of thinking about infrastructure in our work.

Shannon notes that new infrastructures – both hard and soft – are built on old ones. In the case of hard infrastructures, optic fibers are strung where cables and wires are traditionally laid, in sewage ducts and water and gas pipes, and alongside roads and railways. Many of these infrastructures are concentrated in cities or, in the case of satellites, directed towards large urban centers in more industrially and technologically developed parts of the world. Intellectual or soft infrastructures similarly follow old paths in their conceptual design. Despite their path dependency and heavy engineering new infrastructures bear the imprint of human agency, of the people who form part of these infrastructures as links, builders, and deliverers. Human agents are particularly evident when “in particular disenfranchised pockets of the world, when [the] scaffolding [that underlies more economically secure communities] is simply absent.” By turning our attention to the often precarious infrastructures in economically poorer parts of the world we see how splintered our  “seemingly universal infrastructures” are.

The politics of hard and soft infrastructures are cleverly addressed in artist Hito Steyerl’s 2013 video How Not to Be Seen: A F***ing Didactic Educational .MOV File which Shannon Mattern recommends. In this radical work Steyerl declares that resolution determines visibility hence shows the world as a picture. Because pixel calibration determines visibility, she argues, to become invisible one has to become smaller or equal to one pixel, or be any number of things including someone living in a gated community, being in an airport or museum, being a female over 50, undocumented, poor, or “a disappeared person as an enemy of the state. Eliminated, liquidated and then disseminated.” Invisibility becomes a visible network in Steyerl’s film as disappeared people retreat strangely into 3D animations, then hold the vectors together and mesh the picture, then reemerge into a world of pictures as shadows of themselves. The video’s central recurrent image is a cracked and rutted resolution target in the California desert which Steyerl’s voice over says was decommissioned in 2000. “happy pixels hop off into low resolution, gif loop!” Multilayered and cryptic, Steyerl’s .MOV file is worth watching more than once.

Hito Steyerl, How Not to be Seen: A Fucking Didactic Educational .MOV File, (2013).

While artists must critique, it’s still not enough to represent, that is, to reveal and critically analyze, infrastructures, writes Mattern. Creative practitioners should design more just infrastructures, she adds. To do so and in doing so they should “approach infrastructure as a generative structure – a framework for generating systems and environments and objects, and cultivating individuals and communities, that embody the values we want to define our society.”

One of the examples of generative structures that Mattern provides is the use of existing infrastructure to bring about change in the labor conditions of workers in the fast fashion industry in countries like Bangladesh. This calls attention to materiality and affect in the communities involved in the production of clothes we see in store windows on, for example, 34th Street between 5th and 6th. Another example of infrastructure as a generative structure provided by Mattern are mesh networks (see for example The Red Hook Wifi Project [2013]), which are particularly exciting to think about when one thinks of what can happen when infrastructure is not controlled by the community in moments of danger. Two such moments come to mind: Egypt during the Arab Spring, when Vodafone cut off internet and cellphone networks at the height of massive uprisings in Cairo in 2011, causing protesters to lose vital communication with each other about where Egyptian military were firing bullets and consequently being shot down by these. Puerto Rico following Hurricane Maria is another example where mesh networks would have facilitated rescue and recovery.

In less extreme situations landscape urbanism advocates for looking beyond architecture at infrastructures in all their complexity to seek more equitable models. Other fields can follow landscape urbanism’s lead, and an important thing we can do as graduate students is look at the infrastructure that shapes and girds our fields “or what we might call the ‘cultural techniques’ for making knowledge and generating work within a field” (Mattern).

Mattern’s closing message is inspiring and directive:

Recognizing what’s missing in your field’s current infrastructural ecology might inspire you to contribute to the design of a discursive space or a landscape of practice that embodies a political economy more in line with those liberal values that our theories espouse. You, as critical-creative practitioners, have the opportunity to transform criticality into generativity – to imagine and then construct the hard and soft scaffoldings for tomorrow’s fields of practice.

Learning how to code, critically reading artifacts and imagining new ways of doing things are essential to making meaningful contributions in our field. Thinking of infrastructure on all its scales, from corporeal to global, will point to where generative structures most urgently need to be built.


Network Praxis: Shock Incarceration in New York State 2008-18

I had a sneaky feeling that my dataset wasn’t going to work for network analysis, but I had found such a good dataset that I decided to try. This is an Excel spreadsheet compiled by the New York State Department of Corrections listing 602,665 people incarcerated in New York State over the last ten years, with information about admission type, county, gender, age, race/ethnicity, crime and facility. I knew six hundred thousand records were too many, but I figured I’d select just a few, and analyze the networks I would find in these.

The “few” records I selected were those of 771 men and women sentenced in 2018 to shock incarceration, a military-style boot camp initiative that was supposed to reform incarcerated people by subjecting them to strenuous physical and mental trials. According to the U.S. Department of Justice, shock incarceration involves “strict, military-style discipline, unquestioning obedience to orders, and highly structured days filled with drill and hard work.” The data I looked at shows that most people in these facilities were incarcerated for drug-related offenses such as criminal sale of a controlled substance (CSCS) or criminal possession of a controlled substance (CPCS). When marihuana is legalized the population in these facilities – and others – should, I hope, drastically decrease.

I fed the 771 records into Cytoscape and it was a total mess. I tried analyzing only the 106 women sentenced to shock incarceration in 2018 and that was still a mess. The main problem, I realized, was that I could see no clear relationships between the men and women listed in my data other than the relationship they have with the facility in which they are confined. I don’t know who hangs out with whom. I don’t know if people sentenced for different crimes are placed on different floors. It would be too much work to find out who transports the food to the facility and how many guards there are and so on. Frustrated with my project, I saw that trying to get data to bend to software is a lousy way to go about things. I started to think instead about what software would help me explore the data in a meaningful way and decided to see what I could do with Tableau. This was such a good choice that I’m having a hard time stopping myself from building more and more visualizations with what became a wealth of information when I stopped looking for networks that weren’t there.

I couldn’t embed Tableau Public in WordPress so I paste pictures here, but you can’t click and scroll and interact with my visualizations here, and some of the pictures are cut off so please visit my visualization on Tableau. By the way, I was happy to remember that students can get Tableau Desktop for free for a year. Here’s the link: https://www.tableau.com/academic/students

First, here is the mess I made with Cytoscape (I didn’t even try to figure out how to embed):

Isn’t that horrible?! Here’s a close-up:

And here are pictures of what I did with Tableau:

Phew, that’s all for now. See it on Tableau, there’s no comparison.

Digital Technologies in the Public University: More Money-Making or Access for All?

Reading the introduction to Promises and Perils of Digital History by Dan Cohen and Roy Rosenzweig last week, I was intrigued by their mention of neo-Luddite Marxist critic David Noble, which led me off on a tangent which ties in with the pieces on pedagogy we’re reading this week.

Because universities have traditionally hierarchized individual authorities as sources of knowledge and because DH aims to break this hierarchy down, I was interested to see that Cohen and Rosenzweig introduce Noble by aligning him with another neo-Luddite, conservative American historian Gertrude Himmelfarb, who, writing in 1996, didn’t like digital technologies because their equalizing power make “no authority […] privileged over any other” [Himmelfarb qtd in Cohen and Rosenzeig 1]. Although the equalizing power that Himmelfarb is afraid of is something DH embraces, Noble doesn’t engage with this but instead warns us against technology’s power to serve as a tool to mass-market higher education. In “Digital Diploma Mills: The Automation of Higher Education” (1998) Nobles warns that

…the trend towards automation of higher education as implemented in North American universities [in 1998] is a battle between students and professors on one side, and university administrations and companies with “educational products” to sell on the other. It is not a progressive trend towards a new era at all, but a regressive trend, towards the rather old era of mass production, standardization and purely commercial interests. [Nobles para 1]

Noble takes issue not with technology itself but with what capitalists use it for. In the 1980s and ‘90s, he writes, universities were the focus of “a change in social perception which has resulted in the systematic conversion of intellectual activity into intellectual capital and, hence, intellectual property” [Noble para 8]. Research, he argues, was being commodified, and knowledge turned into “proprietary products” that can be bought and sold. As these changes took place, universities were implicated “as never before in the economic machinery” [Noble para 9]. Universities began to allocate funds for science and engineering research – because research had become a commodity – at the expense of education. Then instruction too was commercialized and shaped in a corporate model where costs were minimized by replacing human teachers with computer-based instruction. I think back to the wave of MOOCs that attempted to capitalize on the growing global demand for university degrees and certification around 2012 and what a poor substitute these were for seminars. These were Mills indeed. Then came learning management systems, writes Noble, and educational maintenance organizations contracted through outside organizations. Noble expresses concern that faculty lost the rights to their work as they uploaded syllabi and course content to university websites only to see their scholarship outsourced (I trust that Noble’s concern about ownership of intellectual property is concern that scholarship not be freely shared and not concern that faculty lose power over capital they ‘rightfully’ own). It was also unclear, writes Noble, who owned student educational records once students had uploaded their work to digital sites [para 30]. This is an important question and I hope that FERPA protects student privacy in digital media better now than it did in 1998. Having said that, I think of the query we recently began to write to Voyant about what it does with the corpora we upload, and the question appears to be just as pertinent now. Noble saw students as “no better than guinea pigs” in a massive money-making experiment gone totally wrong [para 30].

In 1998 it seemed to Noble that the technological revolution in higher education was all about corporations (including universities that had become de facto corporations) exploiting the capital that universities had come to contain. And “behind this effort are the ubiquitous technozealots who simply view computers as the panacea for everything, because they like to play with them” [Noble para 15]. Ha. A big problem with Noble’s neo-Luddite position is that he marks a division between people who use computers and those who don’t, as if these were two species apart. It’s important to keep in mind that Noble was writing in 1998. I wonder whether his position towards Digital Humanities would have changed by today (Noble died in 2010) in view of the turn towards free open source digital resources and in view of DH’s growing impact on scholarship, publishing, peer review, tenure and promotion, noted by Matthew Kirshenbaum in “What is Digital Humanities and What’s it Doing in English Departments?” (2012) and taken up by Stephen Brier in “Where’s the Pedagogy? The Role of Teaching and Learning in the Digital Humanities” (2012).

To get a sense of how present pedagogy was in digital humanities work in 2012, Brier looked for the key words pedagogy, teaching, learning and classroom in a summary of NEH grants for DH start-up projects from 2007 to 2010, and found hardly any instances of these key terms. This does not mean that no NEH start-up grants were destined to pedagogical DH projects, writes Brier, but does suggest that “these approaches are not yet primary in terms of digital humanists’ own conceptions of their work.” To start a conversation about the implications of digital technologies in higher education, Brier focuses on the City University of New York, the largest public university system in the United States and one which has grown tremendously over the past five decades in large part, writes Brier, thanks to its readiness to undertake radical experiments in pedagogy and open access.

One of these projects, the Writing Across the Curriculum (WAC) project, came into being to continue the mission that CUNY’s Open Admissions policy, dismantled by the CUNY Board of Trustees in 1999, aimed to accomplish, namely, to ensure that all high school graduates be able to enroll in college and get a college degree. WAC aims to do this by having writing fellows teach writing skills to students who need these. WAC brought digital technologies into the classroom in a natural way, writes Brier, because most writing fellows were interested in developing these.

Brier then points us towards The American Social History Project/Center for Media Learning/New Media Lab, which he co-founded in 1981 and which is deeply committed to using digital media for teaching history in high schools and at the undergraduate level. He goes on to discuss the Interactive Technology and Pedagogy Doctoral Cerfificate Program at the GC, the Instructional Technology Fellows Program at the Macaulay Honors College, Matt Gold’s “Looking for Whitman” project, the CUNY Academic Commons and the GC Digital Humanities Initiative. Now we also have the MA in Digital Humanities and many other initiatives that have come into being since 2012. Given the wealth of initiatives for educational reform developed with digital technologies within CUNY, I like to think that Noble would reverse his Marxist critique of digital technologies in the university were he alive today to witness the equalizing power for educational change digital technologies clearly provide.

Make Space for Ghosts: Lauren Klein’s Graphic Visualizations of James Hemings in Thomas Jefferson’s Archive

In “The Image of Absence: Archival Silence, Data Visualization, and James Hemings,” Lauren Klein discusses a letter by Thomas Jefferson to a friend in Baltimore which she accessed through Papers of Thomas Jefferson Digital Edition , a digital archive which makes about 12,000 and “a significant portion” of 25,000 letters from and to Jefferson available to subscribers of the archive. In this letter, Jefferson asks his friend in Baltimore to give a message to his “former servant James” to illustrate how a simple word search would fail to identify that “James” as his former slave James Hemings, the brother of Sally Hemings, Jefferson’s slave and probably mother of five of his children.[1] Drawing our attention to how the “issue of archival silence – or gaps in the archival record – [which remain] difficult to address” in graphic visualization, Klein notes that the historians who built the Jefferson Papers archive added metadata to indicate that the James referred to in the above-mentioned letter was James Hemings [664]. I wonder what the metadata looks like; I wonder whether it provides sources or reflection, and what the extratextual conversation going on at the back end of the archive, if conversation it is, reveals.

While meta-annotation may appear to be a good way to fill the gaps of archival silence, Klein argues that adding scholarship as metadata creates too great a dependence on the choices the author of the archive made. The addition of metadata to the letter to the friend in Baltimore makes me wonder where in the archive metadata was added, where not, and why. Are all the gaps filled? Had metadata not been added to the letter Klein discusses, an analysis of the archive could conclude that Jefferson never makes any mention of James Hemings in the letter he wrote to his friend in Baltimore in 1801 to try to find Hemings, or in the ensuing correspondence between Hemings and Jefferson through Jefferson’s friend, in which Jefferson tries to hire Hemings and Hemings sets terms that were probably not met [667]. A word search in the archive, however, pulls up only inventories of property, documents of manumission, notes about procuring centers of pork and cooking oysters (Hemings was Jefferson’s chef) and finally a letter in which Jefferson asks whether it’s true that Hemings committed suicide [671]. How, asks Klein, do we fill in the gaps between the pieces of information we have? She concludes that we can’t. How do we show the silences then, she asks; how do we extract more meaning from the documents that exist – letters, inventories, ledgers and sales receipts – “without reinforcing the damaging notion that African American voices from before emancipation […] are silent, and irretrievably lost?” [665].

Klein calls for a shift from “identifying and recovering silences” to “animating the mysteries of the past” [665] but not by traditional methods. Instead, Klein says that the fields of computational linguistics and data visualization help make archival silences visible and by doing so “reinscribe cultural criticism at the center of digital humanities work” [665]. Through visualization Klein fills the historical record with “ghosts” and silences, rather than trying to explain away the gaps. The visualizations she creates are both mysterious and compelling, and bear evidence in a way that adding more words does not.

[1]Sarah Sally Hemings (c. 1773 – 1835) was an enslaved woman of mixed race owned by PresidentThomas Jefferson of the United States. There is a “growing historical consensus” among scholars that Jefferson had a long-term relationship with Hemings, and that he was the father of Hemings’ five children,[1] born after the death of his wife Martha Jefferson. Four of Hemings’ children survived to adulthood.[2] Hemings died in Charlottesville, Virginia, in 1835. [Wikipedia contributors, “Sarah ‘Sally’ Hemings”]

Text mining praxis: mining for evidence of course learning outcomes in student writing

I’ve been hearing more and more about building corpora of student writing of late, and while I haven’t actually consulted any of these, I was happy to have the opportunity to see what building a small corpus of student writing would be like in Voyant. I was particularly excited about using samples from ENGL 21007: Writing for Engineering which I taught at City College in Spring 2018, because I had a great time teaching that course and know the writing samples well.

Of the four essays written in ENGL 21007 I chose the first assignment, a memo, because it is all text (the subsequent assignments contain graphs, charts and images and I wasn’t sure how these would behave in Voyant). I downloaded the student essays from Blackboard as .docx and redacted them in Microsoft Word. This was a bad move because Microsoft Word 365 held on to the metadata, so student email accounts showed up when I uploaded my corpus to Voyant. I quickly removed my corpus from Voyant and googled how do I remove the metadata, then decided that it would be faster to convert all .docx to .pdf and redact them with Acrobat Pro (I got a one-week free trial) so I did this, zipped it up and voila.

22 Essays Written by Undergraduate Engineering Majors at City College of New York, Spring 2018

I love how Voyant automatically saves my corpus to the web. No registration, no logging in and out. There must be millions of corpora out there.

I was excited to see how the essays looked in Voyant and what I could do with them there. I decided to get the feeling of Voyant by first asking a simple question: what did students choose to write about? The assignment was to locate something on the City College campus, in one’s community or on one’s commute to college that could be improved with an engineering solution.

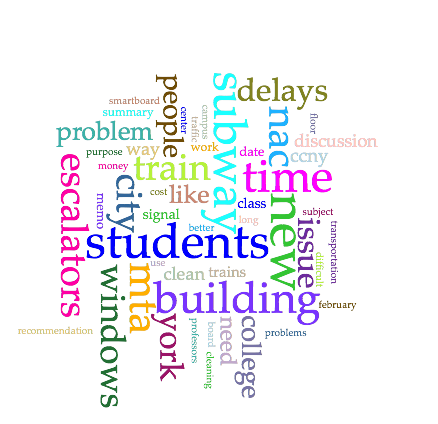
Cirrus view shows most frequently used words in 22 memos written by engineering majors in ENGL 21007

What strikes me as I look at the word cloud is that students’ concern with “time” (61 occurrences) was only slightly less marked than the reasonable – given that topics had to be related to the City College campus – concern with “students” (66 occurrences). I was interested to see that “escalators” (48 occurrences)  got more attention than “windows” (40 occurrences), but I think we all felt strongly about both. “Subway” (56 occurrences) and “MTA” (50 occurrences), which are the same thing, were a major concern. Uploading samples of student writing and seeing them magically visualized in a word cloud summarizes the topics we addressed in ENGL 21007 in a useful and powerful way.

Secondly and in a more pedagogical vein, I wanted to see how Voyant could be used to measure the achievement of course learning outcomes in a corpus of student writing. This turned out to be a way more difficult question than my first simple what did students write about. The challenge lies in figuring out what query will tell me whether the eight English 21007 course learning outcomes listed on the CCNY First Year Writing Program website  were achieved through the essay assignment that produced the 22 samples I put in Voyant, and whether evidence of having achieved or not achieved these outcomes can be mined from student essays with Voyant. Two of the course learning outcomes seemed more congenial to the Memo assignment than others. These are:

“Negotiate your own writing goals and audience expectations regarding conventions of genre, medium, and rhetorical situation.”

“Practice using various library resources, online databases, and the Internet to locate sources appropriate to your writing projects.”

To answer the question of whether students were successful in negotiating their writing goals would require knowing what their goals were. Not knowing this, I set this part of the question aside. Audience expectations was easier. In the assignment prompt I had told students that the memo had to be addressed to the department, office or institution that had the power to approve the implementation of proposed engineering solutions or the power to move engineering proposals on to the department, office or institution that could eventually approve these. There are, however, many differently named addressees in the student memos I put in this corpus. Furthermore, addressing the memo to an official body does not by itself achieve the course learning outcome. My question therefore becomes, what general conventions of genre, medium and rhetorical situation do all departments, offices or institutions expect to see in a memorandum, and how do I identify these in a query? What words or what combinations of words constitute memo-speak? To make things worse (or better :)!), I had told students that they could model their memos on the examples of memos I gave them or, if they preferred, they could model them differently so long as they were coherent and good. I therefore cannot rely on form to measure convention of genre. I’m sorry to say I have no answers to my questions as of yet; I’m still trying to figure out how to ask my corpus if students negotiated audience expectations regarding conventions of genre, medium and rhetorical situation (having said this, I think I can rule out medium, because I asked students to write the memo in Microsoft Word).

The second course learning outcome I selected – that students practice using library resources, online databases and the internet – strikes me as more quantifiable than the first.

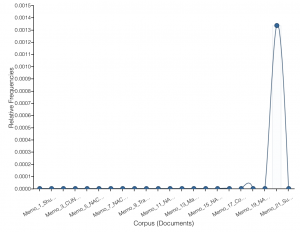
Only one of 22 memos contains the words “Works Cited”

Unfortunately, I hadn’t required students do research for the memos I put in the corpus. When I looked for keywords that would indicate that students had done some research Voyant came up with one instance of “Bibliography,” one instance of “Works Cited” and no instances of “references” or “sources.” The second course learning outcome I selected is not as congenial to the memo assignment – or the memo assignment not congenial to that course learning outcome – as I first thought.

I tried asking Veliza the bot for help in figuring out whether course learning outcomes had been achieved (Veliza is the sister of Eliza, a psychotherapist, and says she isn’t too good at text analysis yet). Veliza answers questions with expressions of encouragement or more questions but she’s not much help. The “from text” button in the lower right corner of the Veliza tool is kind of fun because it fetches sentences from the text (according to what criteria I haven’t a clue) but conversation quickly gets surreal because Veliza doesn’t really engage.

In conclusion, I am unsure how to use text mining to measure course learning outcomes in student writing done in 200-level courses. I think that Voyant may work better for measuring course learning outcomes in courses with more of an emphasis on vocabulary and grammar, such as, for example, EAL. It’s a bit of a dilemma for me, because I think that the achievement of at least some course learning outcomes should be measurable in the writing students produce in a course.